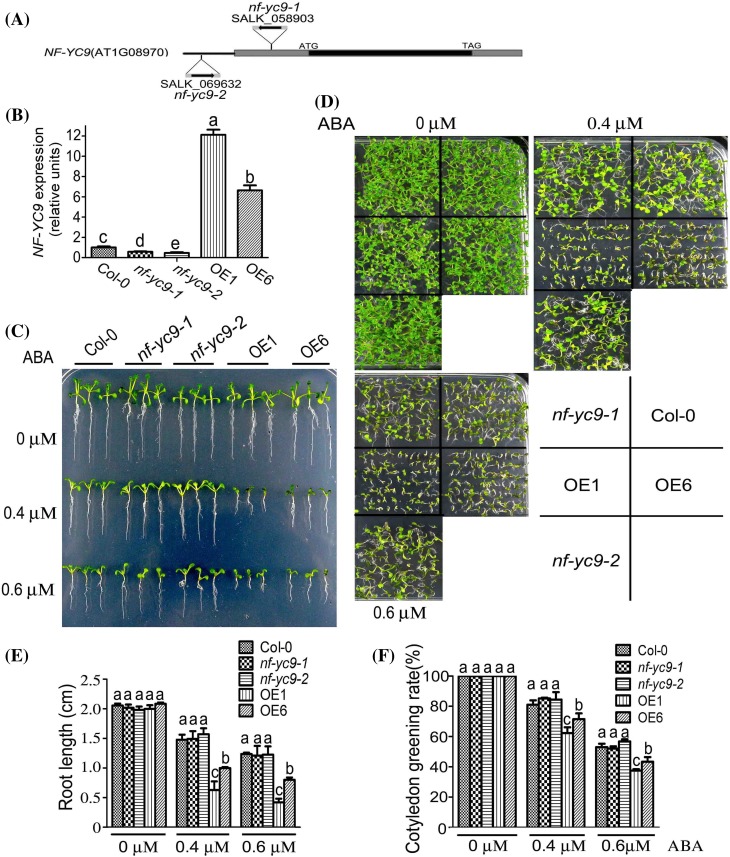
Fig. 1.
Over-expression of NF-YC9 results in ABA hypersensitivity but down-regulation of NF-YC9 expression shows no effect on ABA response during early seedling growth. a Structures of the NF-YC9 gene are shown with the T-DNA insertion site in nf-yc9-1 (SALK_058903) and nf-yc9-2 (SALK_069632). Black box: exon; grey box: 5′ and 3′ UTR; thick line: the promoter region from the start code ATG of the NF-YC9 gene. The black arrowhead indicates the orientation of the T-DNA insertion. b Quantitative RT-PCR analysis of NF-YC9 gene expression in wild-type Col-0, nf-yc9-1, nf-yc9-2 mutants and the NF-YC9 overexpression transgenic lines OE1 and OE6. Expression level of NF-YC9 in all the genetic materials was normalized to that of Actin2/8, and the expression level of NF-YC9 in the wild-type Col-0 was set to 1. Each value is the mean ± SE of three independent biological experiments, and different letters indicate significant differences at P < 0.05 (Duncan’s multiple range test). c Root growth of the different genotypes (the wild-type Col-0, nf-yc9-1and nf-yc9-2 knockdown mutants, and the NF-YC9 overexpression transgenic lines OE1 and OE6) growing on (±)ABA-free (0 μM) and ABA-containing (0.4 and 0.6 μM) MS medium. Seeds were directly sown on the medium, and the root growth was investigated 14 days after a stratification at 4 °C for 3 days. The experiments were repeated four times with similar results. d Post-germination growth of the different genotypes as shown in (c). Seeds were directly sown on (±)ABA-free (0 μM) or ABA-containing (0.4 and 0.6 μM) MS medium, and the growth was investigated 10 days after a stratification at 4 °C for 3 days. The experiments were repeated four times with similar results. e Statistical analysis of root length of the different genotypes described in (c). Each value is the mean ± SE of three independent biological experiments, and different letters indicate significant differences at P < 0.05 (Duncan’s multiple range test) when comparing values within the same ABA concentration. f Statistical analysis of cotyledon greening rate of the different genotypes as described in (d). Green cotyledons were recorded 7 days after a stratification at 4 °C for 3 days. Each value is the mean ± SE of three independent biological experiments, and different letters indicate significant differences at P < 0.05 (Duncan’s multiple range test) when comparing values within the same ABA concentration

