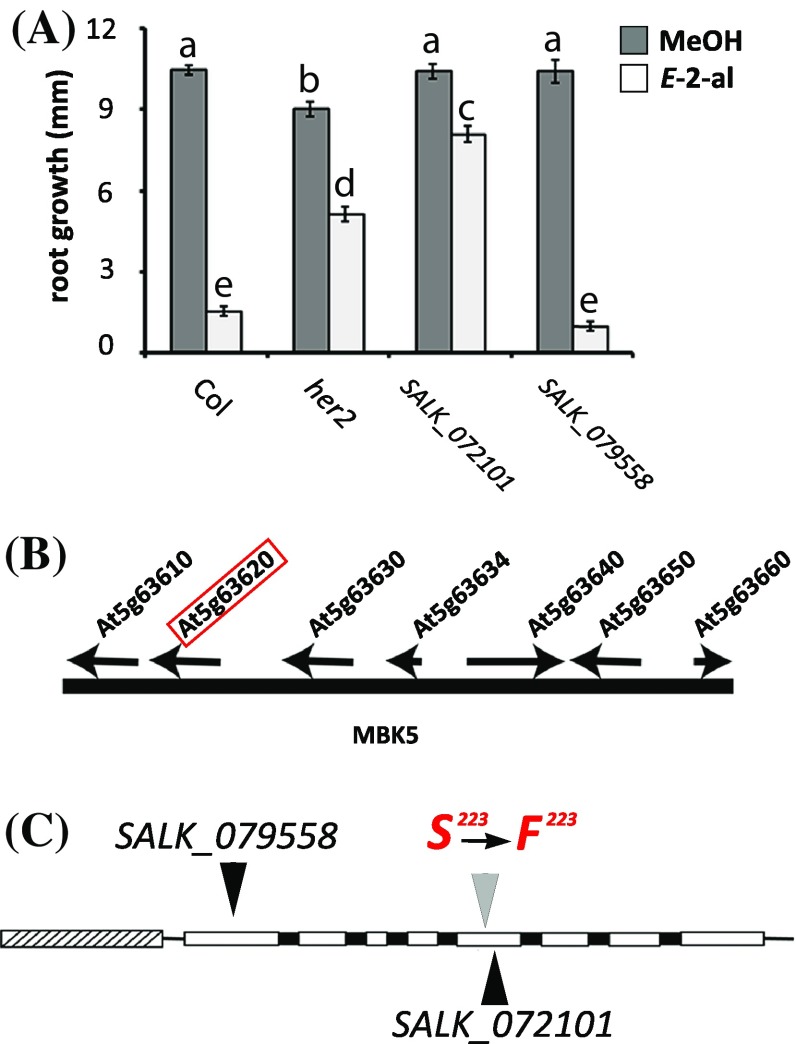
Fig. 1.
Positional mapping of her2 location and response to E-2-hexenal. a Three-day-old seedlings from SALK lines 072101 and 079558, her2 and wild-type Col-0 were exposed for 24 h to MeOH (as a control as E-2-hexenal is dissolved in MeOH) or to 0.3 µM aerial E-2-hexenal. Root growth was measured 3 days after the treatment. Values are the mean root length of at least 15 plants, distributed over three plates (± SEM). Different letters above the bars indicate significant differences at a level of P ≤ 0.05, after applying ANOVA followed by a LSD posthoc test. b Representation of chromosome 5 between nucleotides 25,464,351 and 25,487,847. Arrows denote the position of the genes present in this area. The red box indicates the At5g63620 locus. c Representation of the HER2 genomic region. Exons (white boxes) introns (black boxes) and putative promoter (grey arched box) are shown. Black triangles indicate T-DNA insertions for the Col-0 SALK_072101 (5th Exon) and SALK_079558 (1st Exon) lines. Amino acid 223 (S, serine) is mutated to a phenylalanine (F) in her2

