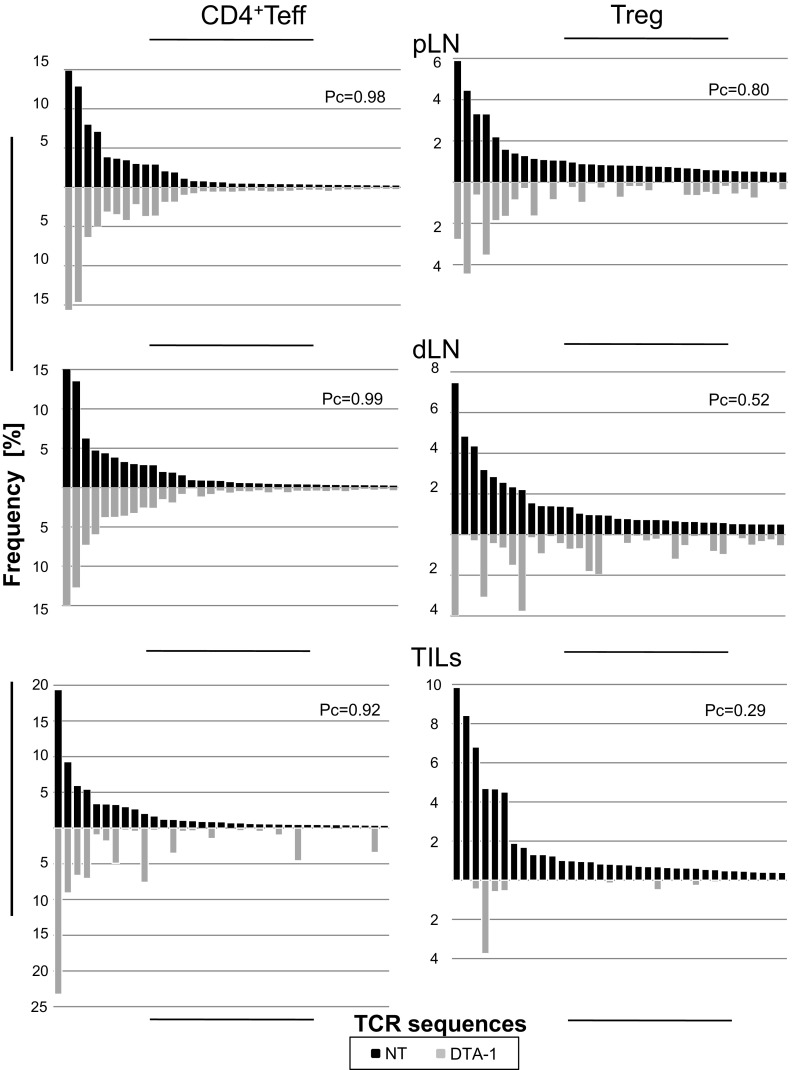
Fig. 3.

Influence of DTA-1 treatment on TCR repertoires of CD4+Teffs and Tregs in indicated anatomical sites of tumor-bearing TCRmini mice. Black bars and gray bars correspond to non-treated and DTA-1 treated mice, respectively. Pearson’s coefficient (Pc) indices are given above each graph
