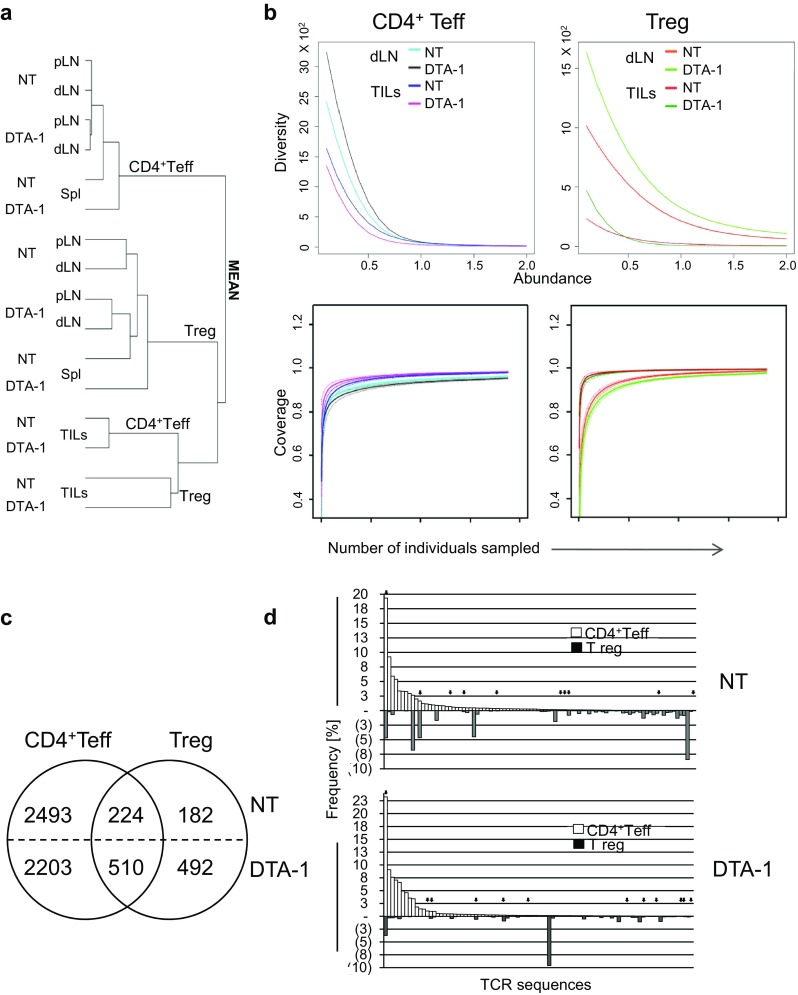
Fig. 4.

Comparison of similarity between a TCR repertoires of Teff and Treg clones from lymph nodes (dLN and pLN), spleen (Spl), and tumor infiltrates (TILs) from untreated (NT) and DTA-1 treated TCRmini mice. b Diversity and coverage of TCRs from CD4+Teff and Treg clones. The hierarchical charts depict similarity indices for TCR repertoires based on high-throughput CDR3 sequencing. c Circle charts show numbers of different TCRs shared by CD4+Teffs and Tregs or expressed only on each of these subsets separately among 2 × 10⁴ TILs from NT or DTA-1 treated tumor-bearing TCRmini mice. d Frequency of 100 dominant TCRs of CD4+Teff TILs (open bars) and corresponding Treg TIL clones (filled bars) from NT (upper panel) and DTA-1 treated (lower panel) tumor-bearing TCRmini mice. Arrows mark TCRs also found on T cell hybridomas derived from the same pool of cells, which responded ex vivo to B16 tumor antigens
