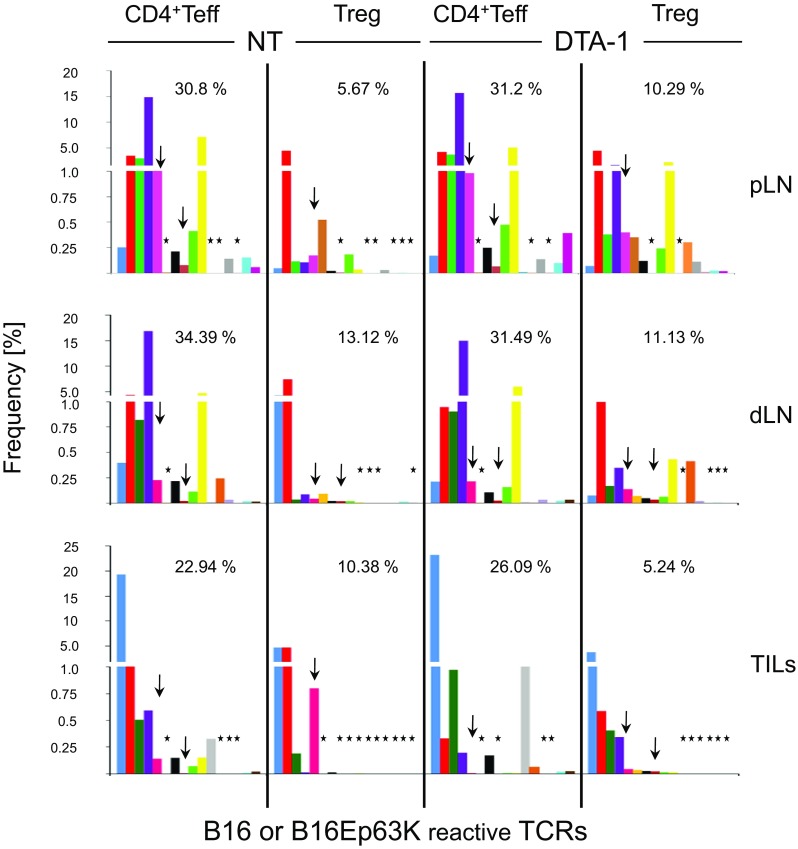
Fig. 5.

Frequencies of 16 B16 reactive TCRs: two of them specific for Ep63K neo-antigen (arrows) among pLN, dLN, and TIL CD4+ T cells. Bars represent given TCR (marked by different colors) expressed on CD4+Teff or Treg clones from tumor-bearing untreated (NT) or DTA-1 treated mice. The absence of given clone is marked by an asterisk
