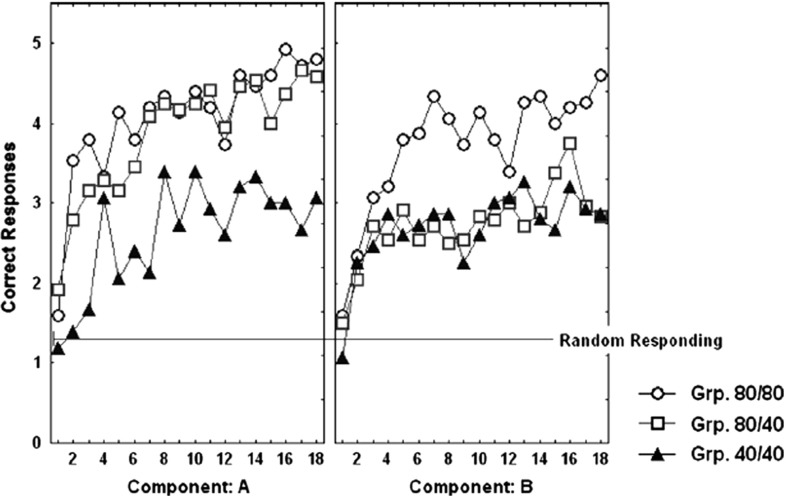
Fig. 11.
Acquisition learning correctness performance for original Svartdal (2008) data. Left Component A results for each of the three subject conditions. Right Component B results for each of the three conditions. Component A concerns stimulus 1 presentations and Component B stimulus 2 presentations. In within-subjects conditions, this results in density 80 (0.8 probability) and 40 (0.4 probability), for the respective components. The difference between Component A and B conditions entail consistent presentations of one of two predictive stimuli arbitrarily selected by the computer program at the beginning of the experiment for a given subject (reprinted with permission from Svartdal 2008). Plots are based on 18 blocks of 5 trials for each component

