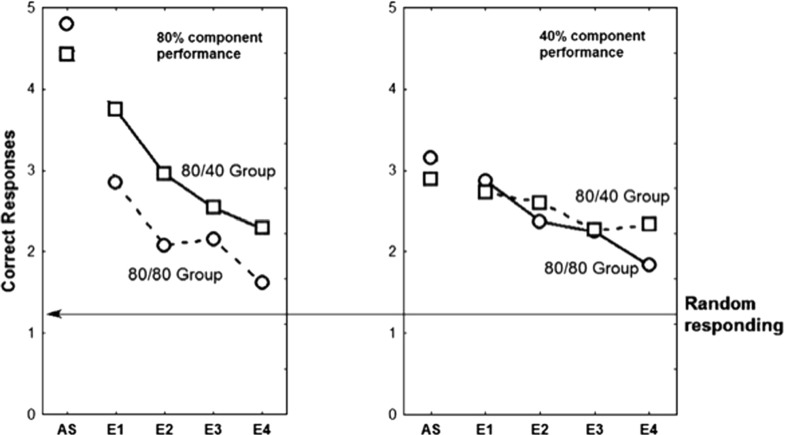
Fig. 24.
Comparison of multiple-schedule components to single-schedule concomitants for original Svartdal (2008) data. Left The 80% component of the 80/40 (multiple-schedule component) is compared to the 80/80 group Component A. Right The 40% component of the 80/40 group is compared to the 40/40 group (note, error in original labelling of Svartdal (2008) Component B. AS acquisition state, E1–E4 extinction performance over four blocks of 10 trials. Reprinted with permission

