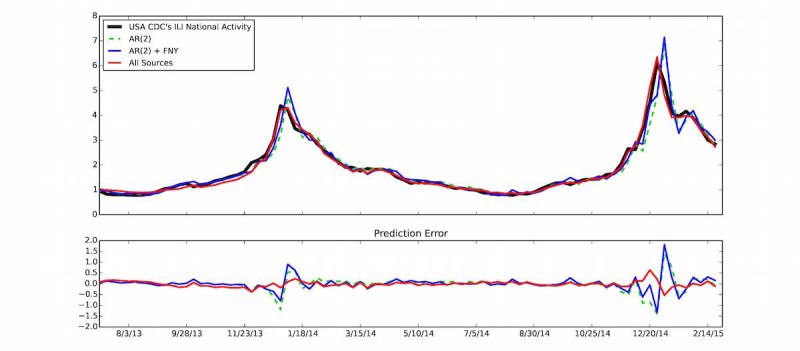
Figure 3.

(Top panel) The US Centers for Disease Control and Prevention (CDC) influenza-like illness (ILI) percent value (y-axis) is displayed as a function of time (x-axis). Predictions produced 1 week ahead of the publication of CDC-ILI reports using (1) only historical CDC information via an autoregressive model, AR(2), (2) an autoregressive model that combines historical CDC information with Flu Near You (FNY) information, AR(2)+FNY, and (3) an ensemble method that combines multiple data sources including FNY, Google search frequencies, electronic health records, and historical CDC information (all sources) are shown. (Bottom panel) The errors between the predictions and the CDC-reported ILI for each prediction model are displayed.
