
Fig. 4.
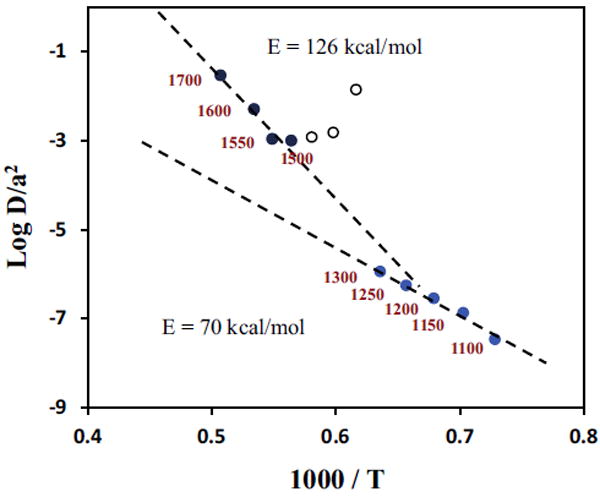
Arrhenius plot, log D/a2 vs. 1000/T, for radiogenic 129*Xe from HH237 chondrule #1. Low temperature and high temperature release peaks (solid symbols) define distinct linear trends with activation energies of ~70 and ~126 kcal mole−1, respectively. Open symbols correspond to the extractions where two peaks are unresolved.