Figure 6.

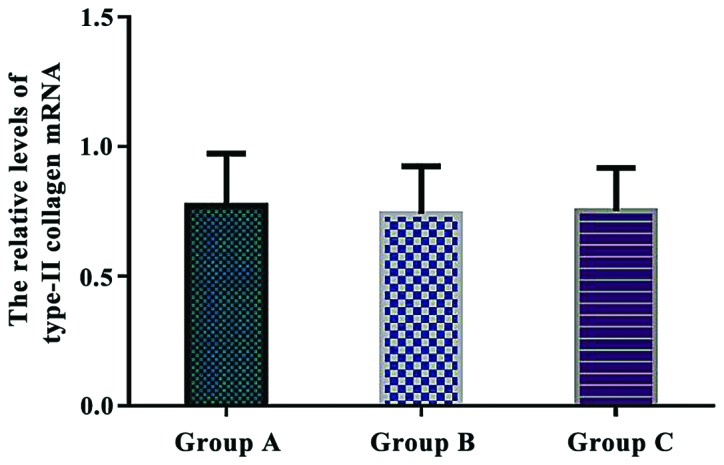
Comparison of the relative levels of type-II collagen mRNA in each group. Real-time quantitative RT-PCR showed that there were no significant differences in the relative levels of type-II collagen mRNA between the three groups (P>0.05).

Comparison of the relative levels of type-II collagen mRNA in each group. Real-time quantitative RT-PCR showed that there were no significant differences in the relative levels of type-II collagen mRNA between the three groups (P>0.05).