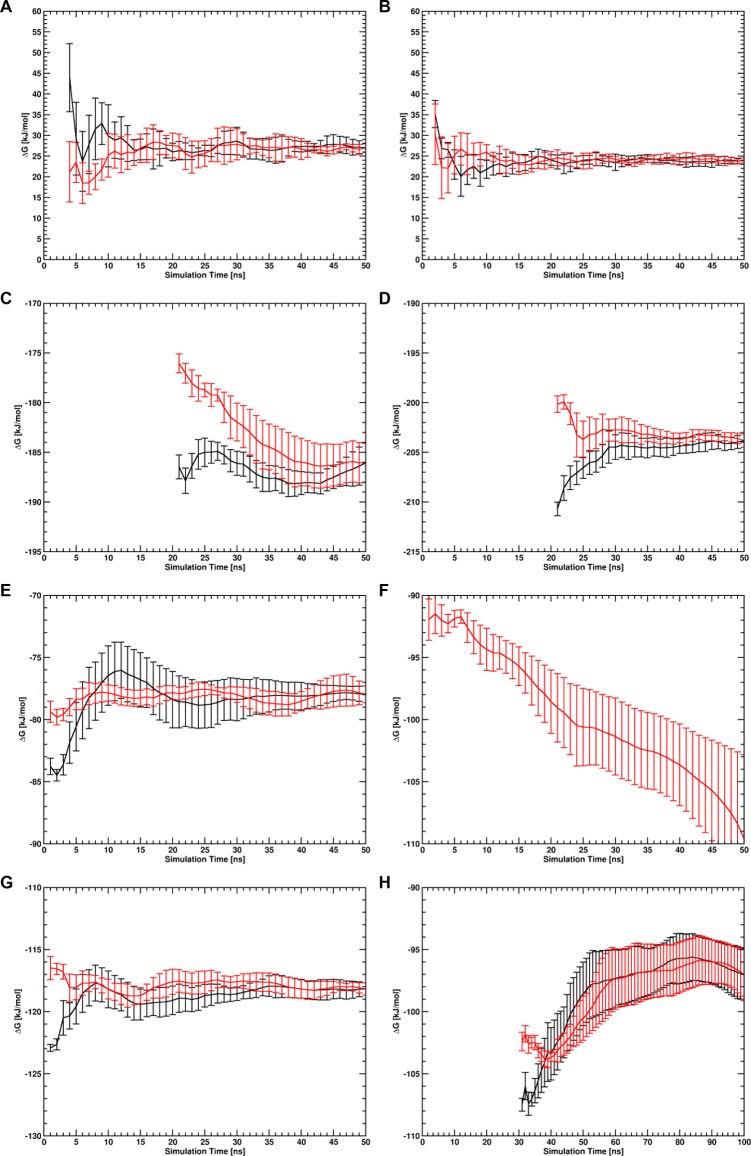
Figure 4.
Forward (black lines) and reverse (red lines) cumulative averages along the trajectories of the free-energy differences calculated with BAR for protein binding and unbinding (ΔGunbindres) in system RS of the wt UBM2 domain (A) and the P692A UBM2 domain (B), for the free-energy contribution of the ENs and specific intermolecular distance restraints in the bound state (ΔGen,dr) of the wt complex (C) and the complex involving P692A UBM2 (D), for the free-energy contributions of the ENs in the unbound state (ΔGen,1u,ΔGen,2) of wt UBM2 (E), P692A UBM2 up to 50 ns total simulation time (F), P692A UBM2 up to 100 ns total simulation time (H) and UBI (G). Simulations of the processes used to obtain (C–H) were performed using SCR potential energy functions. Note that in panel F the forward cumulative average falls off the scale of the plot.

