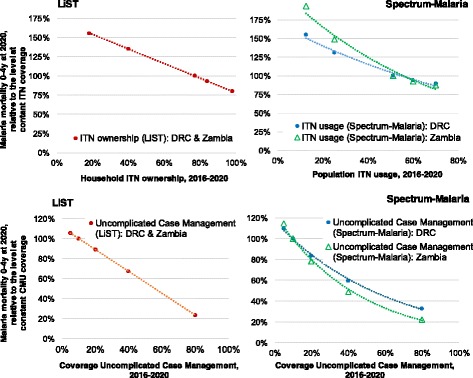
Fig. 4.

Non-linearities in mortality impacts of ITNs and CMU, following scale-up or scale-down at 2016. The y-axes express the mortality level at 2020, in the scale-up or scale-down scenario, relative to the mortality level projected at 2020 under ‘constant’ coverages as shown in Figs. 1, 2 and 3: CMU coverage is kept constant at 10%, ITN household ownership at 77% (in LIST) and ITN usage at 51% (in Spectrum-Malaria); the mortality level at these coverage levels are each displayed as 100%, so as to allow displaying both countries within the same chart despite their differing malaria mortality levels
