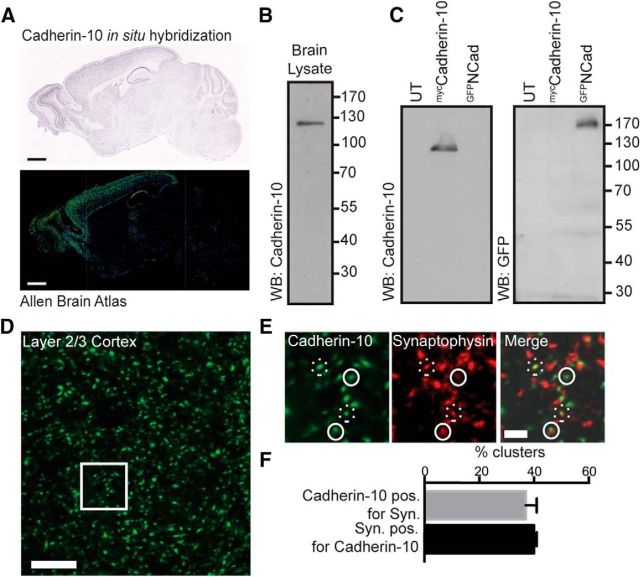
Figure 1.
Expression and distribution of cadherin-10 in cortex. A, In situ hybridization of cadherin-10, reproduced from the Allen Brain Atlas database showing high expression of cadherin-10 in cerebral cortex and CA1 region of hippocampus. Scale bars, 1 mm. B, Representative Western blot (WB) of whole brain lysate, probed with cadherin-10 antibody (n = 4 independent experiments). C, Representative WB of lysates from HEK293 cells expressing myccadherin-10, GFPN-cadherin, or untransfected control (UT). Blots are probed with antibodies to cadherin-10 or GFP (n = 3 independent experiments). D, Light microscopy image of layer 2/3 of cerebral cortex immunostained for cadherin-10. Scale bar, 10 μm. E, Enlargement of the boxed region in D, immunostained for cadherin-10 (green) and synaptophysin (red); closely apposed puncta are marked with solid white circles and overlapping puncta with dotted circles. Scale bar, 2 μm. F, Quantification of cadherin-10 and synaptophysin (Syn.) colocalization showing 37 ± 5% of cadherin-10 clusters were positive (pos.) for synaptophysin and 40 ± 2% synaptophysin clusters were positive for cadherin-10.

