Figure 1.
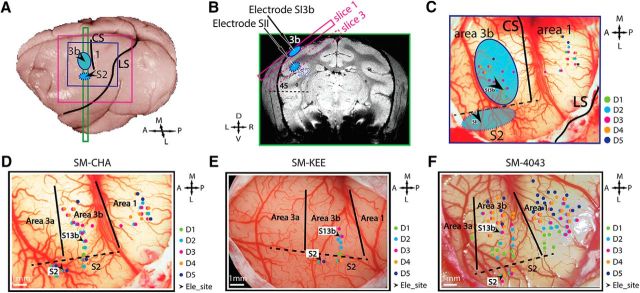
Experimental setup and illustration of microelectrode mapping and recording sites in areas 3b and S2 in 3 normal animals (SM-CHA, SM-KEE, and SM-4043). A, The locations (blue patches) of area 3b and projected S2 on the brain surface. Purple and blue squares represent the FOV of MRI image and blood vessel image for electrophysiology, respectively. CS, Central sulci; LS, lateral sulci; A, anterior; L, lateral; M, medial; P, posterior. B, Coronal T2-weighted structural image shows the placements of oblique MRI slices. Solid and dotted purple rectangle outlines represent slices 1 and 3 covering area 3b and S2 regions, respectively. Blue patches represent the locations of tactile activation. D, Dorsal; V, ventral; L, left; R, right. C, Methods for identifying area 3b and S2 recording sites. Color-coded dots on the corresponding blood vessel map indicate the microelectrode penetration sites and receptive field properties. Black arrows indicate recording sites in areas 3b and S2. Green dots indicate D1 responsive sites. Cyan dots indicate D2 response sites. Purple dots indicate D3 sites. Orange dots indicate D4 response sites. Navy dots indicate D5 response sites. Black arrows indicate the chosen recording sites within each fMRI activation focus (blue patches). Recording sites were logged and illustrated on the corresponding blood vessel map in each animal. For SM-KEE (D), SM-CHA (E), and SM-4043 (F), tactile stimulus was presented on D2 or D3. Black arrows indicate the recording sites in area 3b (700–900 μm in depth) and area S2 (3500–5000 μm in depth). Electrode penetration sites (small colored dots) on each vessel map show the receptive field of different digits. Color-coded individual digit site is shown by the inset column in each animal. Green dots indicate D1. Cyan dots indicate D2. Purple dots indicate D3. Orange dots indicate D4. Navy dots indicate D5. A, Anterior; L, lateral; M, medial; P, posterior. Solid black lines indicate estimated interarea borders. Dotted black lines indicate estimated digit-face borders.

