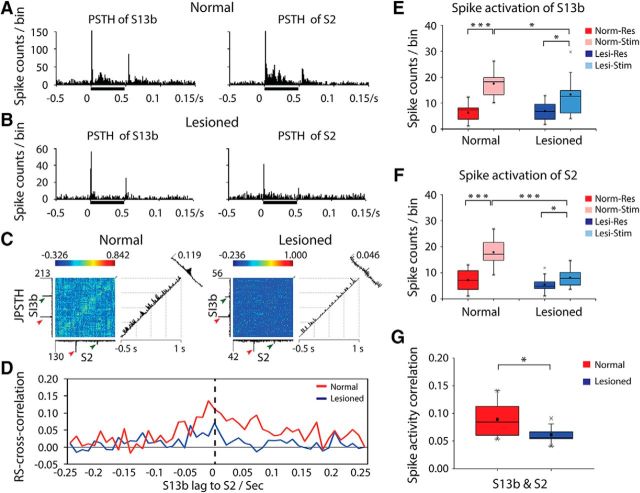
Figure 6.
Effects of DCL on tactile stimulus-evoked spike activity and cross-correlation of spontaneous resting-state spike activity between area 3b and S2 neurons. A, B, Examples of PSTHs in area 3b (left) and S2 (right) in normal (A) and deafferented (B) conditions. Black bars next to x-axes represent tactile stimulation duration. Time of bin = 10 ms. C, Examples of JPSTH of areas 3b and S2 in normal (left) and lesioned (right) monkeys. The main JPSTH matrix plot represents the correlation of bin (bin = 10 ms) counts of S2 and area 3b neurons around the vibrotactile stimulation event: red arrows indicate stimulus onset; green arrows indicate stimulus offset. Histograms to the left of (area 3b) and below (S2) the matrix are standard perievent histograms. The first (diagonal) histogram to the right of the matrix represents the correlations of near-coincident spikes around the stimulus events. The far-right (oblique) histogram represents the cross-correlations of firings of area 3b and S2 neurons. The peak firing counts and peak correlations are labeled. For example, in normal monkey (left), the peak firing counts of area 3b is 213 and the peak firing counts of S2 is 130, whereas the peak spike activity correlation of areas 3b and S2 is 0.119. D, Examples of cross-correlation of spike activities between area 3b and S2 neurons at resting state in normal (red line) and deafferented (blue line) cortex. E, F, Group comparison of spike rates in stimulation versus resting states in area 3b (E) and S2 (F) in normal versus deafferented cortex. Red columns represent resting state in normal animal. Pink columns represent stimulation in normal animal. Blue columns represent resting state in lesioned animal. Light blue columns represent stimulation in lesioned animal. G, Comparison of spike cross-correlation between area 3b and S2 neurons at resting state in normal (red columns) versus input-deprived (blue columns) animals. A total of 20 runs from 3 normal animals, and a total of 13 runs from 3 lesioned animals were acquired for spike measurement (df = 31). *p < 0.05 (unpaired t test). ***p value <0.0005 (unpaired t test). Error bars indicate SE.

