Figure 7.

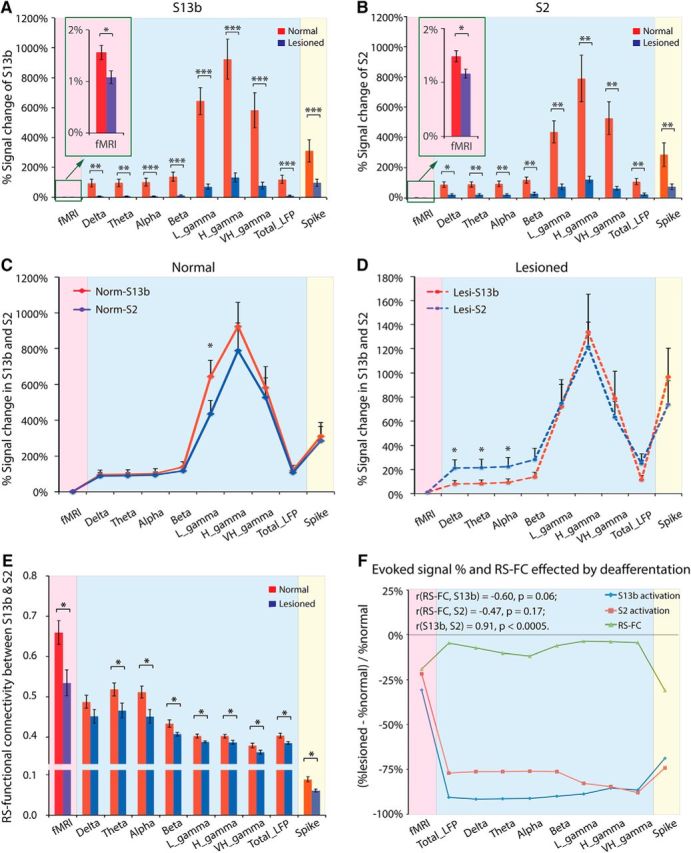
Group comparisons of FC between areas 3b and S2, and those signal changes in normal and input-deprived monkeys used by fMRI, LFP, and spike activity. A, B, Signal changes of fMRI, LFP, and spike activity induced by tactile stimulus in areas 3b (A) and S2 (B) in normal versus input-deprived animals. Red columns represent normal condition. Blue columns represent lesioned condition. C, D, Signal changes of fMRI, LFP, and spike activity induced by tactile stimulus in area 3b versus S2 in normal (C) and lesioned animals (D). The y-axis scale bars in C and D are different. Red lines indicate area 3b. Blue lines indicate S2. E, Summary of rsFC between areas 3b and S2 in normal (red columns) versus lesioned (blue columns) animals derived from different signals. F, Relationship between evoked signal change in areas 3b and S2, and FC change between areas 3b and S2, induced by deafferentation. *p < 0.05 (unpaired t test between normal and lesioned group). **p < 0.005 (unpaired t test between normal and lesioned group). ***p < 0.0005 (unpaired t test between normal and lesioned group).
