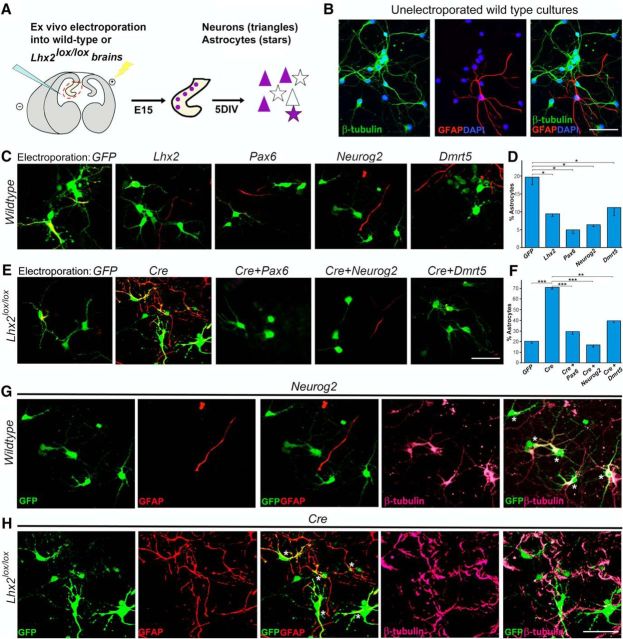
Figure 3.
Pax6, Neurog2, or Dmrt5 can mimic Lhx2 overexpression and can rescue the enhanced astrogliogenesis resulting from loss of Lhx2. A, Diagram illustrating ex vivo electroporation followed by dissociated cell culture. At E15, electroporated progenitors (purple) produce more neurons (purple triangles) than glia (purple stars), and nonelectroporated cells of both types (clear triangles and stars) are also seen. B, A nonelectroporated dissociated cell culture from a wild-type embryo displays β-tubulin-expressing neurons (green) and an occasional GFAP-expressing astrocyte (red). DAPI staining (blue) identifies the nuclei of all the cells in the field. C, D, Dissociated cell cultures from wild-type E15 embryonic hippocampi electroporated ex vivo with constructs encoding GFP, Lhx2, Pax6, Neurog2, and Dmrt5. E, F, Dissociated cell cultures from E15 Lhx2lox/lox hippocampi electroporated ex vivo with constructs encoding GFP, CreGFP, CreGFP+Pax6, CreGFP+Neurog2, or CreGFP+Dmrt5. After 5 d in vitro, the percentage of electroporated (GFP-expressing, green) cells that also expressed astrocyte marker GFAP (red) was scored. D, Quantification of the results reveals 20% of the cells to be astrocytes following control GFP electroporation into wild-type hippocampi, which decreases upon electroporation of constructs encoding neurogenic factors to 9% (Lhx2), 5% (Pax6), 6% (Neurog2), and 11% (Dmrt5). F, In the Lhx2lox/lox background, quantification of the results reveals 21% of the cells to be astrocytes upon control GFP electroporation, which increases to 71% upon loss of Lhx2 as a result of CreGFP electroporation. Coelectroporation of constructs encoding neurogenic factors together with CreGFP restores the percentage astrocytes to 30% (Pax6), 17% (Neurog2), and 39% (Dmrt5). G, H, Individual GFP (green), GFAP (red), and β-tubulin (pink) channels as well as GFP–GFAP and GFP–β-tubulin overlays for Neurog2 electroporation in wild-type hippocampi (G) and Cre electroporation in Lhx2lox/lox hippocampi (H). Asterisks indicate GFP–β-tubulin-coexpressing neurons (G) or GFP–GFAP-coexpressing astrocytes (H). Scale bars: 50 μm. *p < 0.05, **p,0.001, ***p < 0.0001.

