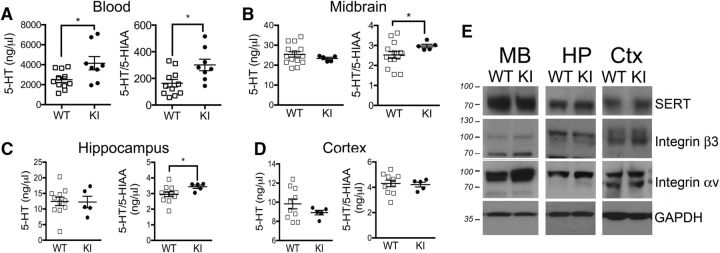
Figure 1.
Altered 5-HT neurochemistry in integrin β3 KI mice. A–D, HPLC analyses of 5-HT and 5-HT turnover (5-HT/5-HIAA ratio) in whole blood and isolated regions of the mouse CNS. A–D, Blood was extracted by cardiac puncture for measurement of whole-blood 5-HT and 5-HIAA (5-HIAA levels: WT mice, 18.36 ± 2.76; KI, 13.44 ± 2.11, p = 0.17; 5-HT, p = 0.04; 5-HT/5-HIAA ratio, p = 0.02; WT mice, N = 11; KI mice, N = 8; A), and 5-HT and 5-HT turnover for midbrain (5-HIAA levels: WT mice, 10.67 ± 0.83; KI mice, 7.87 ± 0.24; p = 0.005; 5-HT/5-HIAA ratio: p = 0.03; WT mice, N = 14; KI mice, N = 5; B), hippocampus (5-HIAA levels: WT mice, 4.37 ± 0.53; KI mice, 4.26 ± 0.38; p = 0.35; 5-HT/5-HIAA ratio: p = 0.03; WT mice, N = 11; KI mice, N = 5; C), and cortex (5-HIAA levels: WT mice, 2.34 ± 0.16; KI mice, 2.13 ± 0.12; p = 0.39; WT mice, N = 10; KI mice, N = 5; D). E, Representative Western blot of synaptosomes isolated from midbrain, hippocampus, and cortices of KI and WT mice. Samples were exposed to anti-SERT antibodies (SERT: WT mice, N = 4; KI mice, N = 3), integrin β3 (WT mice, N = 5; KI mice, N = 6), integrin αv (WT mice, N = 6; KI mice, N = 4) and GAPDH (WT mice, N = 5; KI mice, N = 6). All data were analyzed using an unpaired t test with Welch's correction. *p < 0.05.

