
Fig. 1.
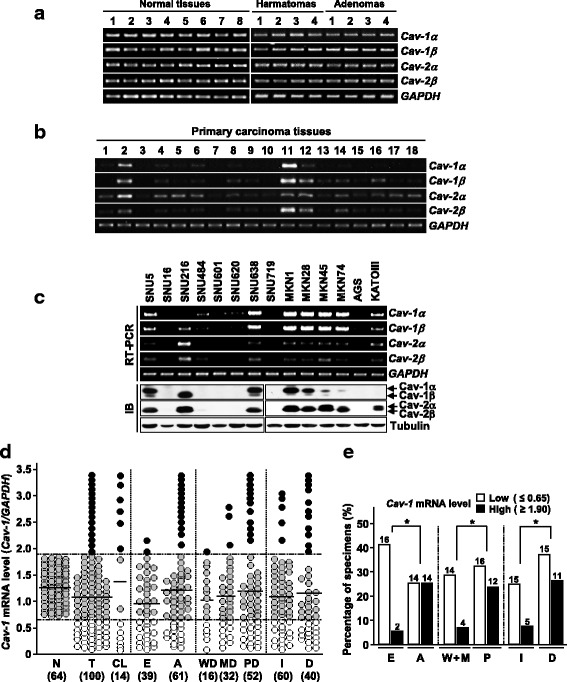
Expression status of Cav-1 in gastric tissues and cell lines. a Quantitative RT-PCR analysis of caveolin expression in normal and benign tumor tissues. b, c Caveolin expression in gastric tissues and cell lines. IB, immunoblot. d, e Association of Cav-1 expression levels with tumor stages, grades, and types. N, normal tissues; T, primary tumors; CL, cell lines; E, early; A, advanced; WD; well-differentiated; MD, moderately differentiated; PD, poorly differentiated; I, intestinal; D, diffused. Bar indicates the mean levels of each specimen group