Fig. 3.

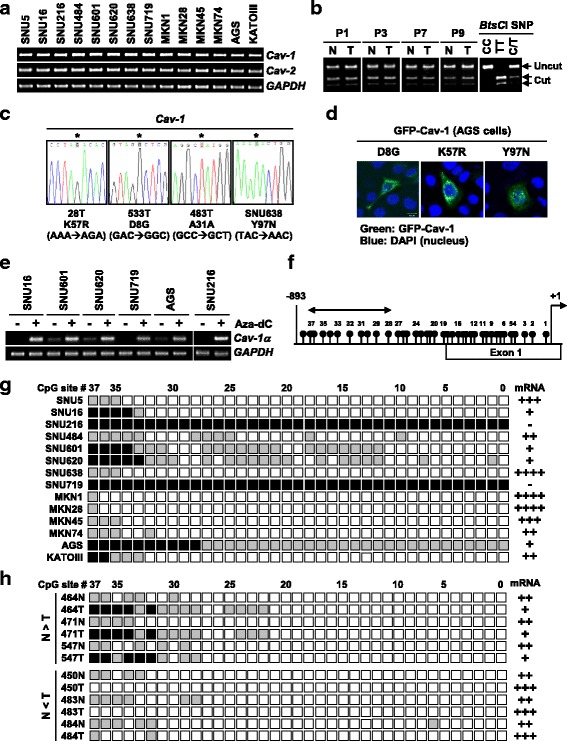
Mutation and promoter methylation analysis of Cav-1 in gastric cancers. a Genomic levels of Cav-1 in 14 cancer cell lines. b LOH analysis of the Cav-1 gene. Exon 3 region containing a SNP (5′-AGCATCC/T-3′) was amplified by PCR and digested with endonuclease BtsCI. P, patient; N, normal; T, tumor. c Sequence alterations of Cav-1 in cell lines and tumors. d Immunofluorescence assay for expression and subcellular localization of mutant Cav-1 proteins in AGS cells. e Quantitative RT-PCR analysis showing re-activation of Cav-1 expression after 5-Aza-dC treatment. f A map of the 37 CpG sites in the promoter and exon 1 region of Cav-1. The first nucleotide of ATG start codon is indicated by an arrow at +1. g Methylation status of the 37 CpGs in 14 cell lines. The gene region comprised of 37 CpGs was amplified by PCR and the PCR products were cloned. Five plasmid clones were sequenced for each cell line. Black, gray, and white circles represent complete methylation (4–5 clones), partial methylation (1–3 clones), and unmethylation, respectively. h Methylation status of the CpGs in primary tumors. N, adjacent noncancerous tissue; T, tumor tissue
