
Fig. 4.
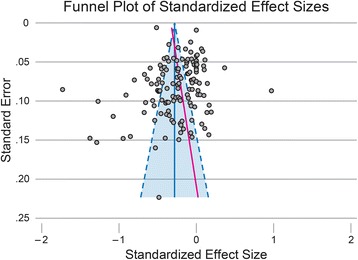
Funnel Plot of Standardized Effect Sizes. The funnel plot demonstrates minimal visual asymmetry, in the direction of excess small studies that resulted in a “negative” outcome (i.e., weight gain = positive effect size). This is supported by the estimated bias coefficient from the Egger test (bias = 1.6, p = 0.03, shown as red solid line). Dotted lines represent the pseudo-95% confidence interval