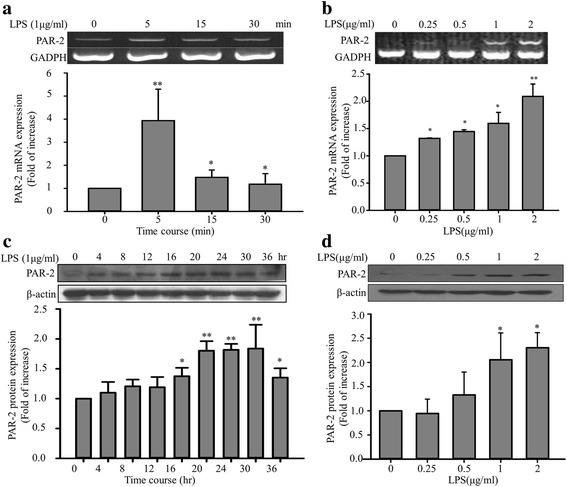
Fig. 1.

Effects of LPS pretreatment on PAR-2 expression in EA. hy926 cells. EA. hy926 cells were treated with LPS at different concentrations and treatment durations. Cellular RNA was isolated, and RT-PCR and Western blotting were performed to assess PAR-2 mRNA and protein levels, respectively. a EA. hy926 cells were stimulated with LPS (1 μg/mL) for 0, 5, 15, and 30 min. PAR-2 and GAPDH mRNA levels were determined through RT-PCR. The PAR-2 mRNA levels were normalized to the control values of GAPDH (%). b EA. hy926 cells were stimulated with different LPS concentrations (0, 0.25, 0.5, 1, and 2 μg/mL) for 15 min. c Effects of LPS pretreatment on PAR-2 protein expression. EA. hy926 cells were stimulated with LPS (1 μg/mL) for 0, 4, 8, 12, 16, 20, 24, 30, and 36 h. The PAR-2 protein levels were normalized to the control values of β-actin (%). d EA. hy926 cells were stimulated with different LPS concentrations (0, 0.25, 0.5, 1, and 2 μg/mL) for 24 h. Bar graphs represent means ± SEM from three independent experiments. *p < 0.05 compared with the control group; **p < 0.01 compared with the control group
