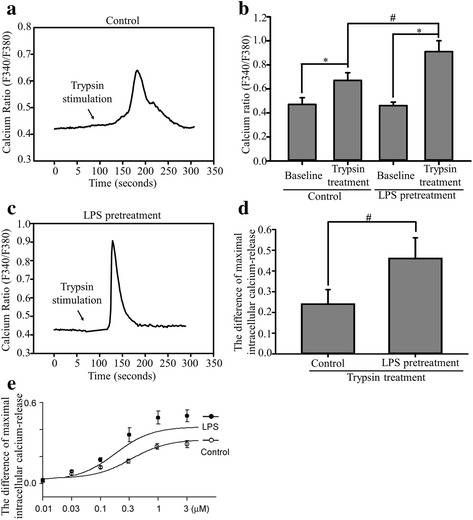
Fig. 2.

Effects of LPS pretreatment on trypsin-induced intracellular Ca2+ release in ECs. EA. hy926 cells were left untreated (control group) or pretreated with 1 μg/mL of LPS for 24 h (LPS pretreatment group) and stimulated with 2 μg/mL of trypsin. a Trypsin exposure induced an increase in intracellular Ca2+ release (F340/F380 nm) in EA. hy926 cells. The arrow indicates trypsin addition to the superfusion solution. b Bar graph of the maximal calcium release before and after trypsin stimulation in ECs. The basal intracellular Ca2+ release without trypsin was used as the baseline. Trypsin treatment significantly increased the maximal intracellular Ca2+ release. c Trypsin induced an increase in intracellular Ca2+ release in the LPS-pretreatment group. d Bar graph of the differences in the trypsin-induced maximal intracellular Ca2+ release in the control and LPS pretreatment groups. Bar graphs represent means ± SEM from six independent experiments. e Concentration–response curves for the trypsin-induced increase in intracellular Ca2+ release in the absence and presence of LPS pretreatment for 24 h in ECs. The data are presented as mean ± SEM (n = 6). *p < 0.05 compared with the control group; # p < 0.05 compared with the LPS pretreatment group
