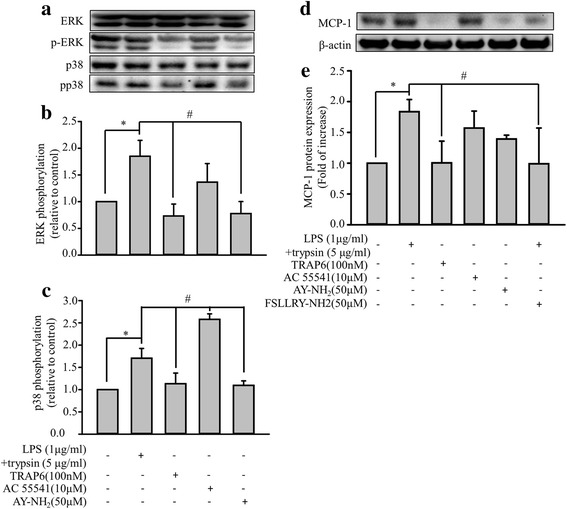
Fig. 7.

Effects of LPS-plus-trypsin, selective PAR (PAR-1, PAR-2, PAR-4) agonists, and PAR-2 antagonist in EA. hy926 cells. a Effects of LPS-plus-trypsin, and selective PAR (PAR-1, PAR-2, PAR-4) agonists on ERK/p38 phosphorylation. EA. hy926 cells (1 × 10⁶/mL) were treated with LPS (1 μg/mL) for 24 h and then with trypsin (5 μg/mL) for 10 min, PAR-1 agonist (TRAP6, 100 nM), PAR-2 agonist (AC 55541, 10 μM), or PAR-4 agonist (AY-NH2, 50 μM) for 24 h. Control cells were treated with 0.1% DMSO. Representative data of the p-ERK, total ERK, p38, and pp38 MAPK levels. b Normalization of the p-ERK and total ERK levels. c Normalization of the p-p38 and total p38 levels. Bar graphs represent means ± SEM from three independent experiments. *p < 0.05 compared with the control group. d Effects of LPS-plus-trypsin, selective PAR (PAR-1, PAR-2, PAR-4) agonists, and PAR-2 antagonist (FSLLRY-NH2 50 μM) on MCP-1 secretion. EA. hy926 cells (1 × 10⁶/mL) were treated with LPS (1 μg/mL) for 24 h and then with trypsin (5 μg/mL) for 10 min, PAR-1 agonist (TRAP6, 100 nM), PAR-2 agonist (AC 55541, 10 μM), PAR-4 agonist (AY-NH2, 50 μM) for 24 h, or pretreated with PAR-2 antagonist (FSLLRY-NH2, 50 μM) for 30 min then LPS-plus-trypsin treatment. Control cells were treated with 0.1% DMSO. MCP-1 protein levels were quantified through immunoblotting, and β-actin was used as the loading control. The upper panel shows a typical blot. e Normalization of the MCP-1 and total β-actin levels. Bar graphs represent means ± SEM from three independent experiments. *p < 0.05 compared with the control group. #p < 0.05 compared with the LPS-plus-trypsin treatment group
