
Fig. 3.
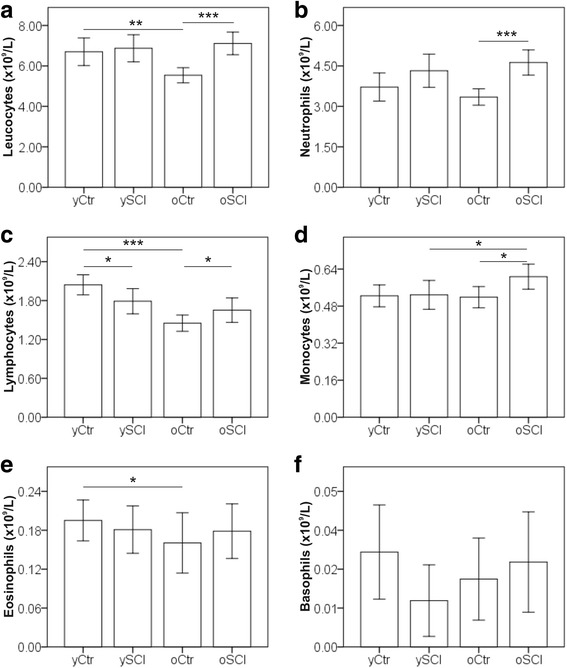
Leucocyte differential counts in study participants. Mean cell concentrations for leucocytes (a), neutrophils (b), lymphocytes (c), monocytes (d), eosinophils (e) and basophils (f) are shown for the four groups: able bodied controls <60 years (yCtr, n = 42), SCI < 60 years (ySCI, n = 42), able bodied controls ≥60 years (oCtr, n = 42) and SCI ≥ 60 years (oSCI, n = 43). Error bars mark the 95% confidence intervals. Significant differences are indicated as *: p < 0.05, **: p < 0.01 and *** p < 0.001