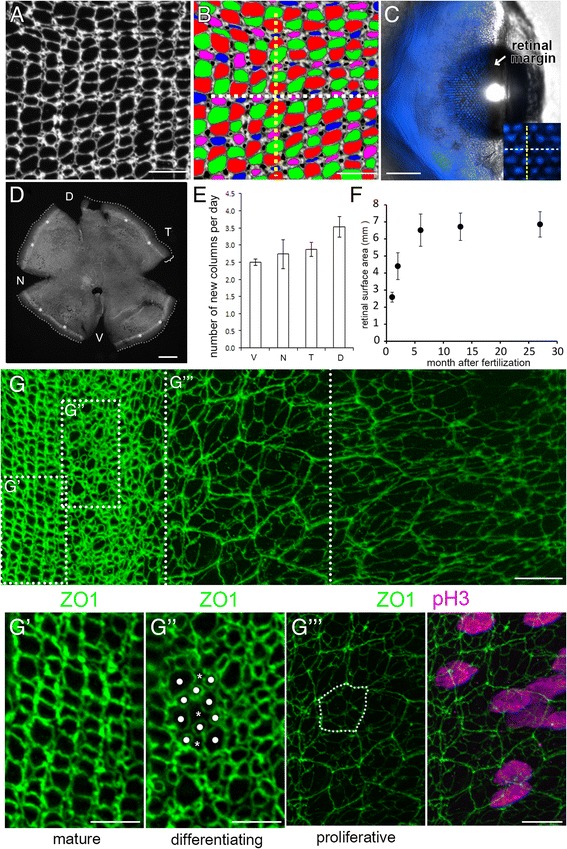
Fig. 1.

Emergence of the photoreceptor lattice mosaic in rapidly growing juvenile zebrafish. (A) Retinal flat-mount immunolabeled for ZO1. (B) Same as panel A, with cone profiles colored per spectral identity (UV cones in magenta); rods in black. Cone columns (dashed yellow line); rows of UV-Blue cones (dashed white line). (C) Live imaging, early larval Tg(sws2:mCherry; ruby) zebrafish eye, Blue cone-specific reporter (blue) viewed from the dorsal side, cornea to the right; spherical lens. Inset: Blue cone rows (white dashed line) orthogonal to, and columns (yellow dashed line) parallel to, the retinal margin. (D) Flat-mount retina; ring of EdU-labeled cells (asterisks) parallel to the retinal margin; cells added in the 10-day interval after the EdU pulse (bracket). D,Dorsal; N, Nasal; T, Temporal; V, Ventral. (E) Columns of cones added per day by retinal quadrant. Mean ± 1 s.d., n = 3. (F) Retinal surface area as a function of age. Mean ± 1 s.d., n = 4–6 for each age. (G) Flat-mount preparation of retinal margin and overlying retinal pigmented epithelium (RPE) in a juvenile zebrafish (maximum intensity z-projection of ZO1, in green). (See also Additional file 2: Figure S1 and Additional file 3: Movie S1.) (G’-G”) High magnification of boxes in G. Mitotic marker, pH3 (magenta; overlay in G”’, right panel). In the differentiating zone, immature photoreceptors have rounded profiles (dots) and Müller glial apical profiles are irregular polygonal shapes (asterisks). RPE cells (dashed line) in a separate, closely apposed epithelium (see Additional file 2: Figure S1B and Additional file 3: Movie S1). Scale bars: 10 μm (A, B, G, G”’); 100 μm (C); 200 μm (E); 5 μm (G’, G”)
