
Figure 5.
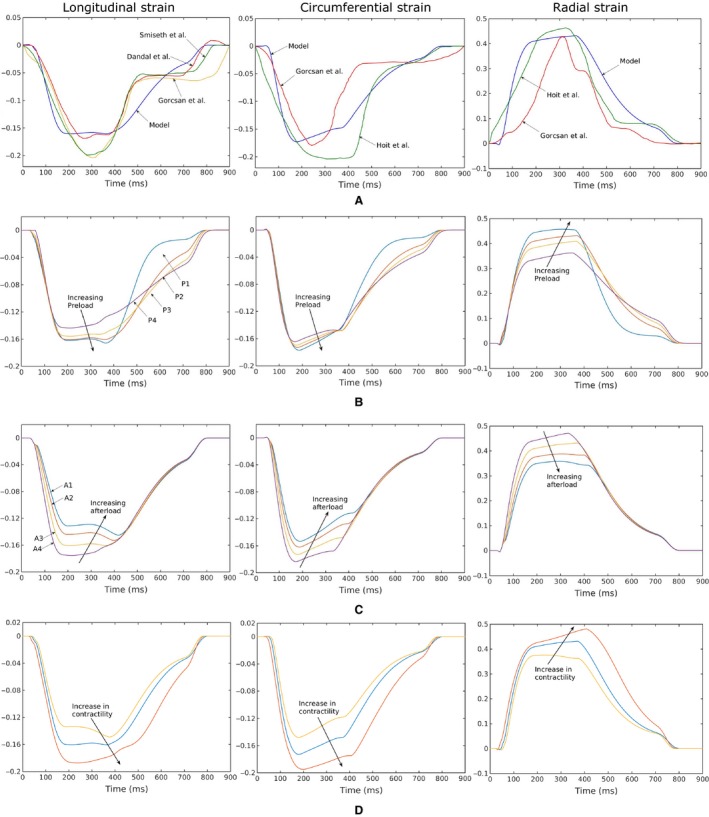
Longitudinal (first column), circumferential (second column), radial (third column) strain‐time profiles. (A) Comparison of the model predictions with previously published in vivo 2D STE measurements (Dandel et al. 2009; Gorcsan and Tanaka 2011; Hoit 2011). Strain‐time profiles predicted by the model with, (B) different preload (with constant afterload), (C) different afterload (with constant preload) and, (D) different contractility for a representative case (case P2 shown in Fig. 4A and C).