
Figure 3.
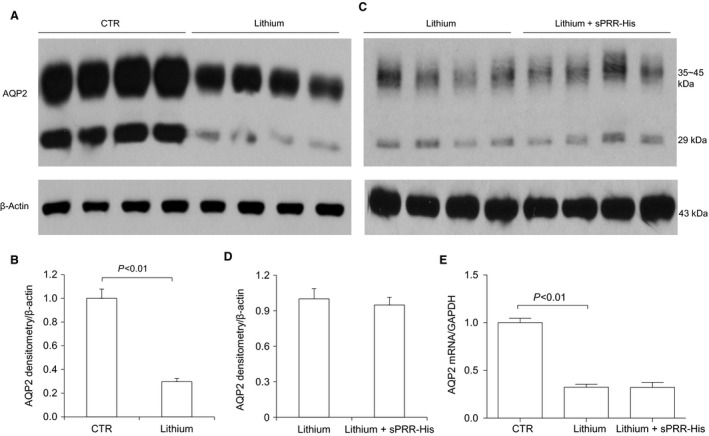
Effect of sPRR‐His on AQP2 expression in lithium loaded mice. Renal AQP2 expression was determined by immunoblotting analysis (A–D) and qRT‐PCR (E). (A) Representative blot for comparison between CTR and lithium groups. (B) Densitometric analysis of the data in (A) (n = 10 per group). (C) Representative blots for comparison between lithium and lithium + sPRR‐His groups. (D) Densitometric analysis of the data in (C) (n = 10 per group). (E) qRT‐PCR analysis of renal AQP2 mRNA expression (n = 5 per group). Data are mean ± SE.