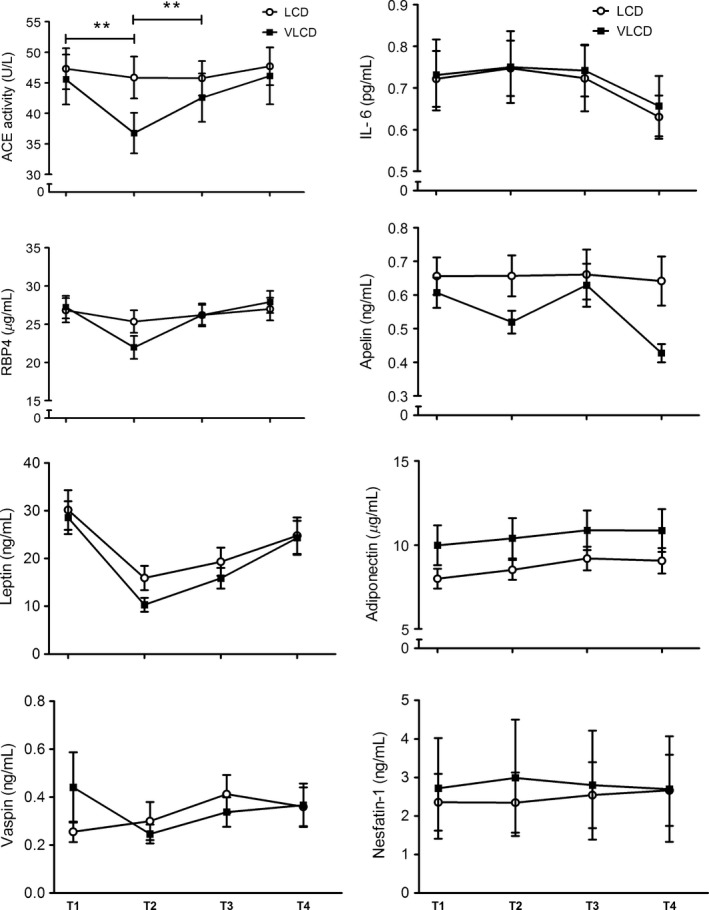
Figure 2.

Concentrations of several adipokines and other biomarkers at T1, T2, T3, and T4 in the low‐calorie diet (LCD) group and very‐low‐calorie diet (VLCD) group. Significant diet × time interactions were observed for angiotensin‐converting enzyme (ACE) activity and RBP4. Post hoc analysis: **P < 0.01, significantly different between dietary groups (Bonferroni corrected). Values are mean ± SEM.
