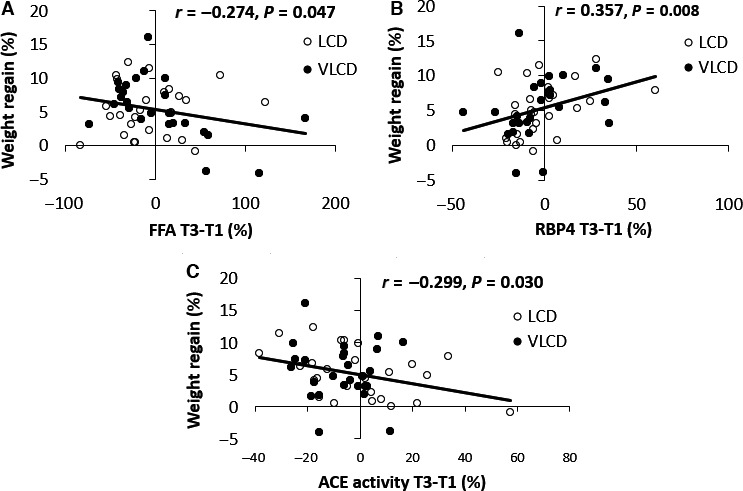
Figure 3.

Correlations between weight regain (%) and percentage change in FFA (A) and RBP4 (B) concentrations and angiotensin‐converting enzyme (ACE) activity (C) during the DI period (T3–T1) in the low‐calorie diet (LCD) group and very‐low‐calorie diet (VLCD) group. The trendline, correlation (r) and P‐values are shown for the whole group.
