
Figure 3.
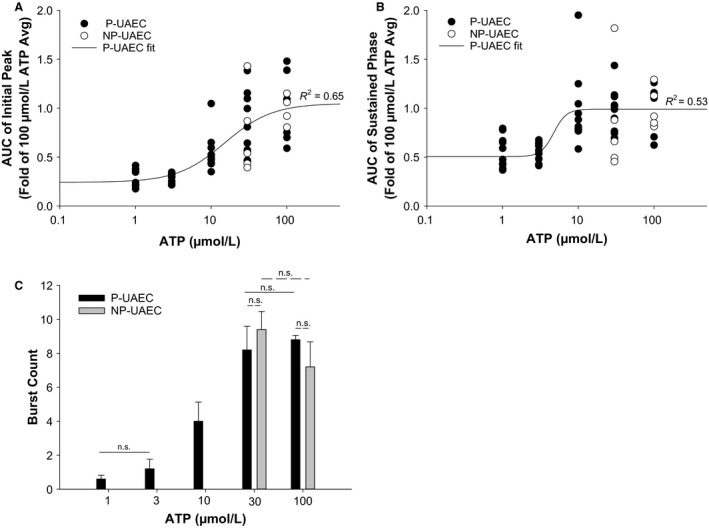
ATP Dose Response Effects on AUC of Initial and Sustained [Ca2+]i in UAEC. P‐UAEC were stimulated with ATP (1, 3, 10, 30 or 100 μmol/L) and the observed [Ca2+]i elevation over time was reported as Area Under the Curve (AUC). Each dish response is reported as fold of the respective group's average 100 μmol/L response (n = 59 cells per dish, P = 6–10/NP = 5 dishes per dose). (A) For the initial [Ca2+]i peak, the sigmoidal curve fit of the ATP versus AUC continues to increase with ATP dose as expected. (B) The sustained [Ca2+]i phase sigmoidal curve fit of ATP versus AUC shows maximal [Ca2+]i response occurred even at submaximal doses of ATP. All regression fits are P < 0.0001. (C) In P‐UAEC, ATP dose‐dependently effects the number of [Ca2+]i bursts observed in dish‐averaged tracings during the sustained phase (n = 5 dishes per dose ± SEM). P‐UAEC burst count data follow a more progressive dose–response than seen in “B” AUC of the sustained phase. No significant difference is noted for P‐UAEC versus NP‐UAEC dish count burst average for 30 or 100 μM ATP.