
Figure 7.
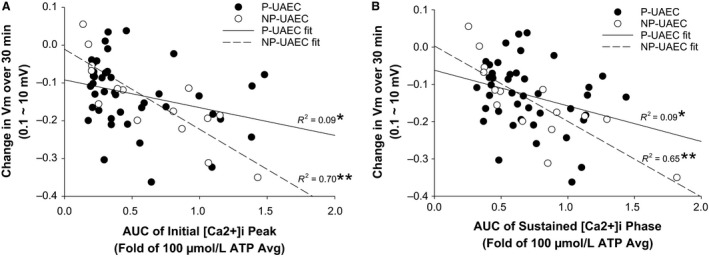
Correlation of area under the curve (AUC) of [Ca2+]i to changes in V m. P‐UAEC stimulated with ATP (0, 1, 3, 30, or 100 μmol/L) or NP‐UAEC (0, 30, 100 μmol/L) show an increase in total [Ca2+]i during both an initial (0–300 sec) and sustained (300–1800 sec) phase. The AUC was calculated for each dish as a fold of the respective P or NP‐averaged 100 μmol/L response and was plotted against the corresponding change in V m over 30 min. P‐UAEC and NP‐UAEC data were fit using a linear curve. (A) The relationship between net V m change and the AUC of the initial [Ca2+]i peak is stronger in NP‐UAEC than in P‐UAEC. Small changes in AUC in P‐UAEC were associated with a span of minimal to maximal V m changes for individual dishes. (B) Data points are widely scattered with little correlation between the AUC of the sustained [Ca2+]i phase and V m change in P‐UAEC, but NP‐UAEC show a stronger correlation between elevated [Ca2+]i and V m change. Data points are dish averages (n = 9–10 dishes per dose, 59 cells per dish). Regression fits are significant at *P < 0.05 for P‐UAEC and **P < 0.0005 for NP‐UAEC.