Figure 1.

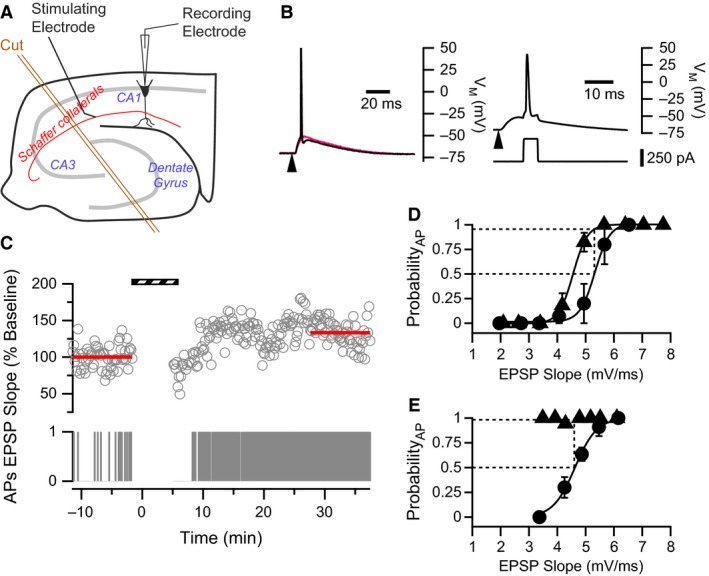
Measuring P50 Firing to gauge E‐S potentiation in CA1 neurons. (A) Schematic diagram showing the configuration for hippocampal slice experiments, noting Schaffer collateral stimulation and CA1 whole‐cell recording sites. An incision made to isolate the CA1 circuit is also depicted (orange double lines). (B) Examples of evoked EPSPs from representative CA1 pyramidal cells. Left: Test pulses consisted of stimulation to the Schaffer collaterals (arrowhead) that evoked EPSPs. Two such EPSPs with similar initial slopes are shown. The same stimulus intensity was used to evoke both EPSPs; however, 30–40% of the time, EPSPs were suprathreshold and evoked an AP (black trace), whereas other times EPSPs were subthreshold (red trace). Right: Pairing protocol. Upper voltage trace shows an evoked EPSP followed by an AP which was evoked by a current pulse (lower trace) delivered to the postsynaptic cell soma with an 8 ms delay. Arrowhead indicates stimulation of the Schaffer collaterals to evoke the EPSP. (C) Example showing that WPP yielded a modest increase in EPSP slope and a strong increase in AP firing. Upper trace represents EPSP slopes normalized to the baseline. Lower panel is a binary raster plot of AP Firing. In the AP raster plot, 1 represents the presence of an AP evoked by a suprathreshold EPSP, whereas 0 represents the absence of an AP. Stripped bar indicates when WPP was applied. (D & E) P50 Firing values reflect changes in E‐S coupling. Two examples of E‐S relationships before (filled circles) and after (filled triangles) WPP. In both examples, data were collected utilizing a range of stimulus intensities applied to the Schaffer collaterals. (D) An example where variability in sub‐ and suprathreshold EPSPs generates E‐S curves with a sigmoidal relationship. Solid lines represent fits to Equation 1. Fitted parameters before WPP: ES 50 = 5.3 mV/ms, n = 0.27; after plasticity induction: ES 50 = 4.6 mV/ms, n = 0.25. The dotted lines illustrate how P50 Firing values are calculated (see Methods). P50 Firing in this neuron is 0.95. (E) In some CA1 neurons from saline‐treated rats, complete E‐S curves could not be constructed after WPP because of the dramatic increase in (E‐S) coupling. Yet, P50 Firing values still reflect shifts in E‐S coupling after the induction protocol. Fitted parameters (Equation 1) before plasticity induction: ES 50 = 4.6 mV/ms, n = 0.32. P50 Firing in this neuron is 1.0.
