Figure 4.

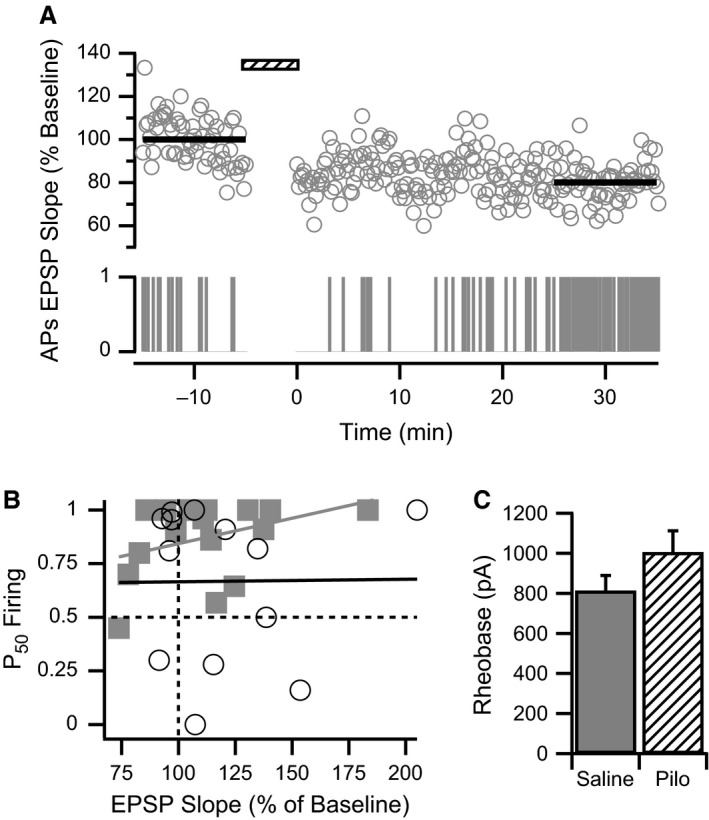
E‐S plasticity is dissociated from synaptic plasticity. (A) E‐S potentiation can be observed concurrently with LTD. Example shows concurrent time courses of normalized EPSP slope (upper graph) and a raster plot of AP firing (lower graph) from a CA1 pyramidal cell from a saline‐treated rat before and after WPP (hatched bar). Averaged EPSP slopes (thick black lines) indicate approximately 20% LTD after WPP. However, the AP Firing raster plot (APs) indicates a gradual increase in AP firing after WPP. (B) Synaptic plasticity and E‐S plasticity are not correlated. P50 Firing is plotted against normalized EPSP slopes after WPP for each CA1 neuron from pilocarpine‐treated (open circles) and saline‐treated (filled squares) rats. Vertical dashed line indicates no synaptic plasticity, whereas horizontal dashed line indicates no E‐S plasticity. Correlation for CA1 cells from control (gray line) and pilocarpine‐treated (black line) rats, respectively: P = 0.21, r 2 = 0.095, n = 18 from 14 animals; P = 0.64, r 2 = 0.021, n = 13 from 8 animals. (C) Rheobase measurement of minimal current injection required to reliably evoke a single AP is similar for CA1 cells from saline‐treated and pilocarpine‐treated (Pilo) animals.
