
Figure 5.
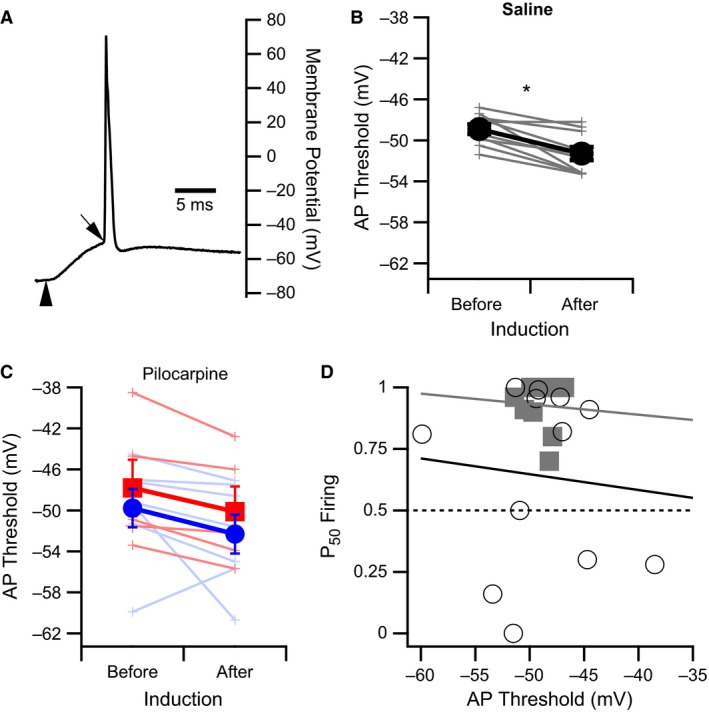
Reduction in AP threshold after WPP is similar for CA1 neurons from saline‐ and pilocarpine‐treated rats. (A) Representative trace of an AP evoked from a suprathreshold EPSP generated from Schaffer collateral stimulation (vertical arrowhead) in a CA1 pyramidal cell from a saline‐treated rat. Diagonal arrow indicates the inflection point defining AP threshold used to generate the data shown in B and C. (B and C) AP thresholds measured from CA1 pyramidal cells from saline‐treated rats (B) and pilocarpine‐treated rats (C) before and 30 min after WPP. Lines indicate paired measurements. Filled symbols indicate the average values. A slight hyperpolarizing shift in the means for both experimental groups was observed (filled circles). * indicates a significant difference of P < 0.001 for data from saline‐treated rats. (C) AP thresholds measured from CA1 pyramidal cells from pilocarpine‐treated rats have been grouped according to P50 Firing values. Blue lines and symbols indicate cells in which the P50 Firing values > 0.5, whereas red lines and symbols indicate cells with P50 Firing values ≤ 0.5. There was no significant difference in AP thresholds before and after WPP for each group. However, when grouped together the p value was less than 0.05. (D) No correlation was found between P50 Firing values and AP threshold for CA1 neurons from saline‐treated (filled squares and black line) or pilocarpine‐treated (open circles and gray line) rats. Dashed line indicates no change in E‐S plasticity after WPP.