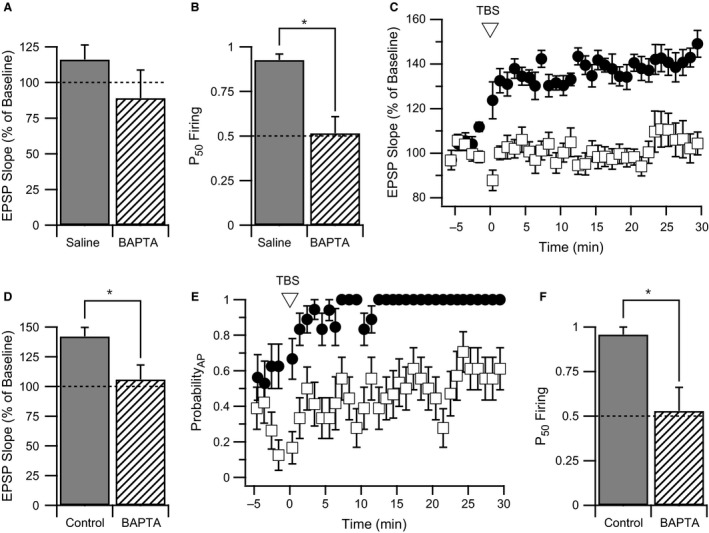
Figure 7.

E‐S potentiation and LTP are both dependent on intracellular calcium elevation. A and B. Average normalized EPSP slope change (A) and P50 Firing (B) 30 min after WPP for CA1 pyramidal neurons filled with either normal K‐gluconate intracellular recording solution (solid bars) or K‐gluconate solution containing 30 mM BAPTA (hatched bars). Data of saline‐treated controls for change in EPSP slope and P50 Firing are the same as Figures 3C and D, respectively. No significant difference in EPSP slope change was observed between groups; however, a significant decrease in P50 Firing was observed. * indicates a P < 0.01. (C) EPSP slope time course averages for control and BAPTA‐treated cells following theta burst stimulation for LTP induction (TBS). In control cells (filled circles), a robust EPSP slope potentiation was observed. With 30 mM BAPTA intracellular solution (open squares), EPSP slope potentiation was abolished. (D) Bar graph of EPSP slope change at 30 minutes following TBS for control and BAPTA‐treated CA1 cells. * indicates a P < 0.05. (E) AP probability time course for control (filled circles) and BAPTA‐treated (open squares) CA1 cells following TBS. In control cells, AP probability rapidly climbs to 100% following TBS. An intracellular solution containing 30 mM BAPTA prevented an increase in AP probability. F. Bar graph of P50 Firing in control and BAPTA‐treated CA1 cells following TBS. * indicates a P < 0.05.
