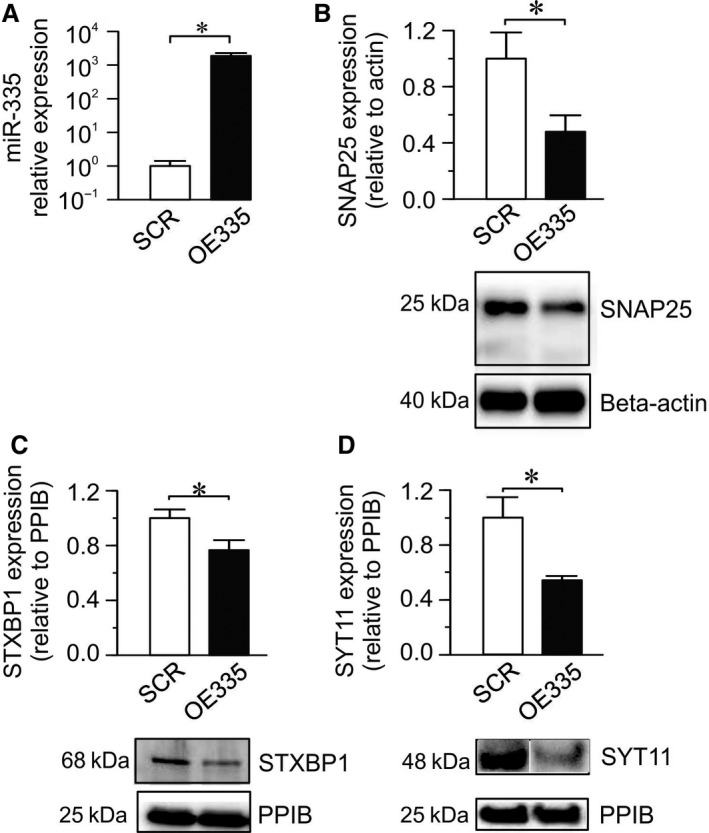
Figure 2.

Overexpression of miR‐335 and its effect on the expression of three of its putative protein targets. (A) Expression of miR‐335 using mature miR‐335 mimic (OE335; black bar) relative to its expression using scramble control (SCR; white bar). Mir‐335 expression was normalized to endogenous controls U6 and U87. (n = 4; *P < 0.05). (B, C, D). Average protein levels of SNAP25, STXBP1 and SYT11 in OE335 (black bar) compared to SCR (white bar) cells (n = 4 each group; *P < 0.05). Representative western blots are shown for each protein. Expression levels were normalized to beta‐actin or cyclophilin B (PPIB).
