Figure 4.

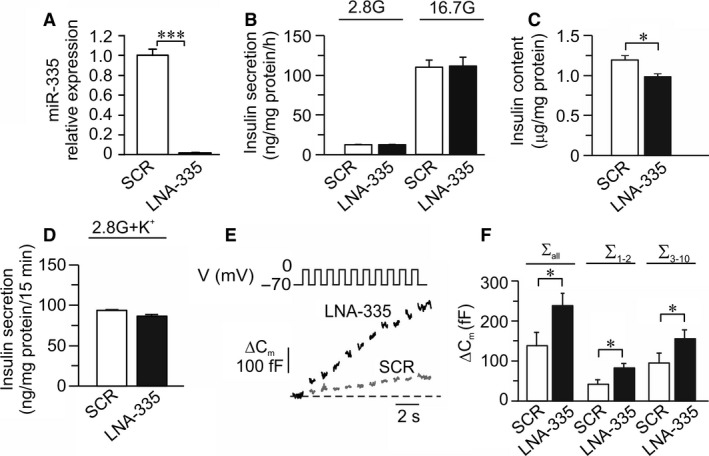
Influence of miR‐335 knockdown on insulin secretion and exocytosis in INS‐1 832/13 cells. (A) Expression of miR‐335 in cells after knockdown of miR‐335 by LNA against miR‐335 (LNA335; black bar) relative to expression in scramble control cells (SCR; white bar). n = 4; ***P < 0.001. (B) Insulin secretion in LNA335 (black bars) and SCR (white bars) cells after stimulation for 1 h in 2.8 mmol/L or 16.7 mmol/L glucose as indicated (n = 4). The amount of released insulin is measured using human/rat insulin‐ELISA. (C) Insulin content in LNA335 (black bars) and SCR (white bars) cells. n = 8; *P < 0.05. (D) Insulin secretion in OE335 (black bars) and SCR (white bars) cells after stimulation for 15 min. in 2.8 mmol/L glucose with 50 mmol/L K+. n = 4. (E) Representative traces of depolarization‐induced increases of membrane capacitance in LNA335 (black trace) and SCR (gray trace) cells. (F) Summary of capacitance changes presented as the summed increased in membrane capacitance during all ten depolarizations (ΣDepolall), increase evoked by the first two depolarizations (ΣDepol1‐2) or the latter eight depolarizations (ΣDepol3‐10). n = 10 for LNA335 (black bar) and n = 9 for SCR (white bar) cells; *P < 0.05
