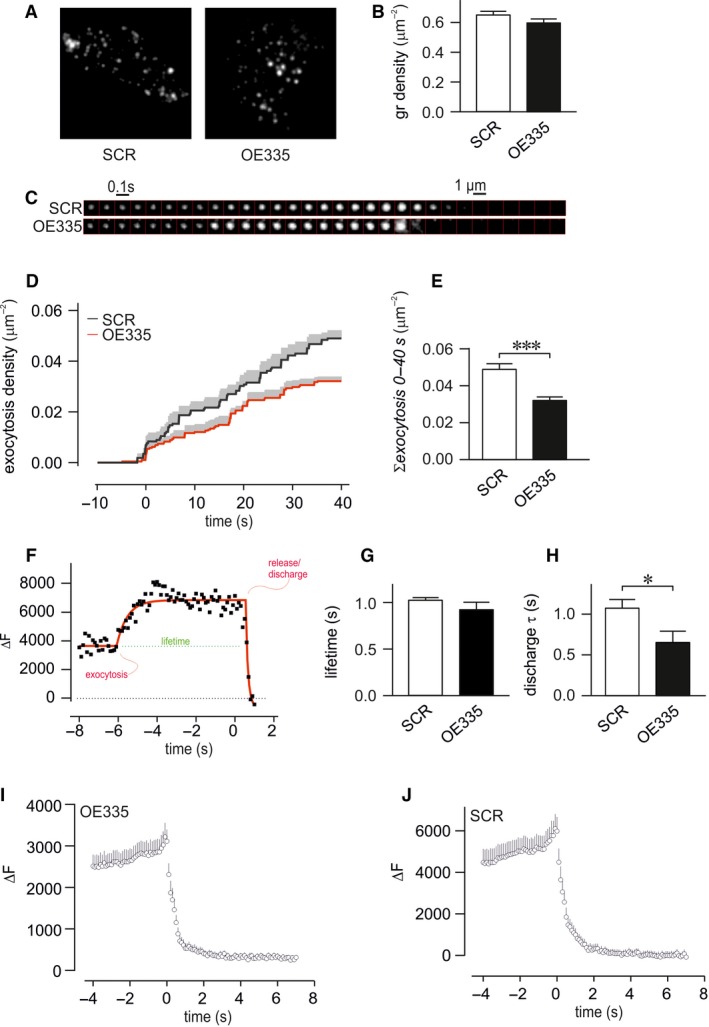
Figure 5.

Function of miR‐335 on density of granules and exocytosis measured by TIRF microscopy in INS‐1 832/13 cells. (A) Representative TIRF images of OE335 and SCR cells co‐transfected with NPY‐mEGFP. (B) Density of granules in OE335 (black bar; n = 31) and SCR (white bar; n = 53) cells. (C) Examples of single exocytosis event measured in OE335 and SCR cells, frames are 100 msec apart. Exocytosis was stimulated through depolarization using elevated K+. (D, E) Cumulative number of exocytosis events per area in OE335 and SCR cells (n = 8 each group; ***P < 0.001). (F) Representative image of fluorescence time course during a single exocytosis event (black) with fit overlaid (red) illustrating the numerical analysis. The interval between the moments of exocytosis/fusion and release is taken as fusion pore lifetime (green). (G, H) Summary of fitted exocytosis and decay constants of individual events as described in (F) The lifetime of the events (*P=n.S.) and decay constant from individual granules during content release (*P < 0.05) was measured in OE335 and SCR cells (n = 8 each group). (I,J) Average fluorescence signal of granule fluorescence for exocytosis events in OE335 and SCR cells as in C.
