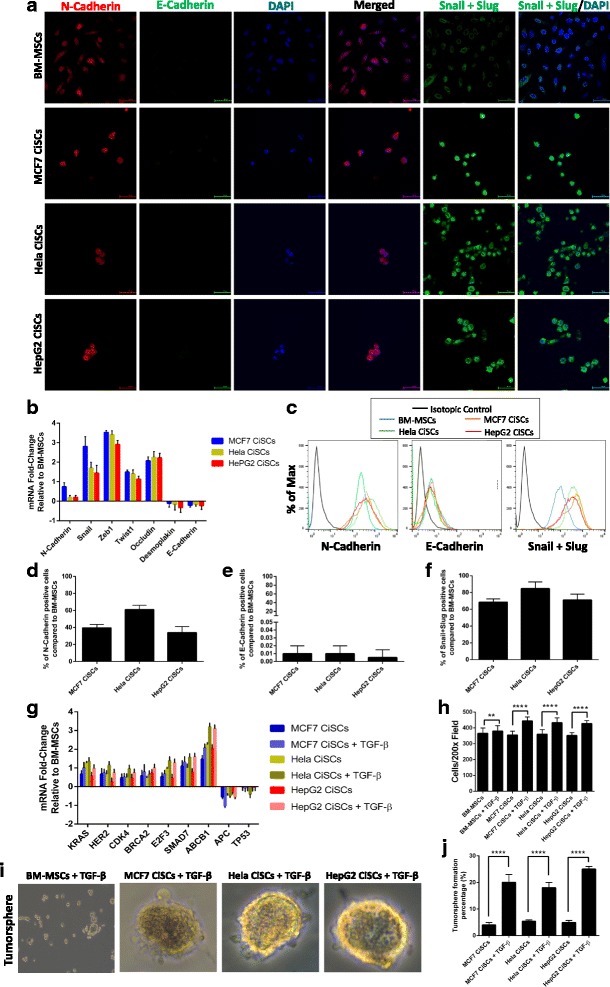
Fig. 6.

CiSCs exhibit a more mesenchymal phenotype compared to their parental BM-MSCs. a Confocal immunofluorescence images for N-Cadherin (red), E-Cadherin (green), and Snail + Slug (green) of MCF7, Hela, and HepG2 CiSCs. Nuclei stained with DAPI (blue). Scale bars = 60 μM. b Expression levels of mRNAs encoding N-Cadherin, Snail, Zeb1, Twist, Occludin, Desmoplakin, and E-Cadherin in MCF7, Hela, and HepG2 CiSCs relative to parental BM-MSCs as determined by real-time qRT-PCR. Data reported on a log-10 scale as mean ± SD. c Flow cytometry overlay histogram analysis of N-Cadherin, E-Cadherin, and Snail + Slug in BMMSCs and in MCF7, Hela, and HepG2 CiSCs. For comparison, isotype control (black) was used to define the positive and negative population for each marker. d–f Quantification of percentage of (d) N-Cadherin (e) E-Cadherin, and (f) Snail + Slug positive cells compared to the parental BM-MSCs by intracellular flow cytometry staining. Proportions of positive cells measured by subtracting the control parental BM-MSC staining from test histograms using super-enhanced Dmax (SED) normalized subtraction using FlowJo v. 10.2 software. Data presented as mean ± SD. g Expression levels of mRNAs encoding KRAS, HER2, CDK4, BRCA2, E2F3, SMAD7, ABCB1, APC, and TP53 in MCF7, Hela, and HepG2 CiSCs after treatment with 20 ng/ml of TGF-β for 7 days as determined by real-time qRT-PCR. Data reported on a log-10 scale as mean ± SD. h Quantification of invading CiSCs toward the lower chamber of the insert after treatment with 20 ng/ml of TGF-β for 7 days showing CiSCs to have a significantly higher invasive properties after treatment with TGF-β (**P < 0.05 and ****P < 0.001) (average of 10 picture fields at 200× total magnification for each cell type). i Phase-contrast images of tumorspheres formed from MCF7, Hela, and HepG2 CiSCs after treatment with 20 ng/ml of TGF-β for 7 days. j Quantification of tumorsphere-forming ability of MCF7, Hela, and HepG2 CiSCs after treatment with 20 ng/ml of TGF-β for 7 days showing CiSCs to have a significantly higher tumorsphere formation percentages after treatment with TGF-β (P < 0.05). Data presented as mean ± SD. BM-MSC bone marrow mesenchymal stem cell, CiSC cancer-induced stem cell, TGF-β transforming growth factor beta
