Figure 4.

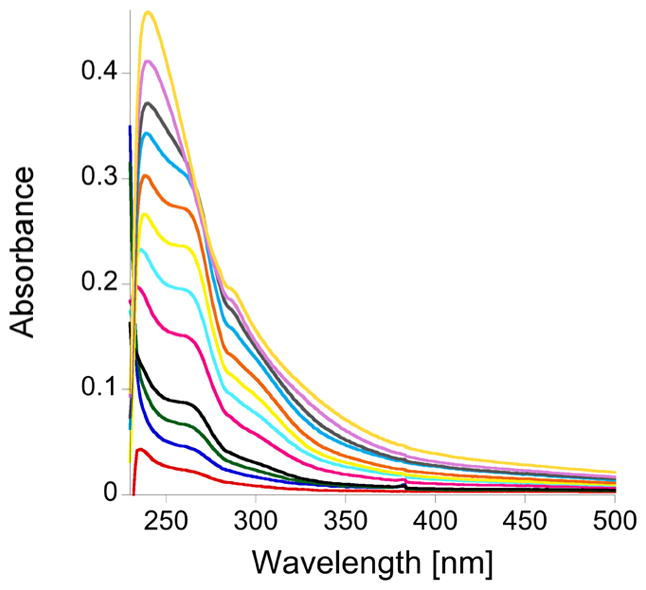
Plot of the change in the absorption spectrum, between 230 and 500 nm, as CuCl is is added to apo-TTP-2D. The apo-TTP-2D spectrum was subtracted, and the titration was performed in 200 mM HEPES, 100 mM NaCl, at pH 7.5.

Plot of the change in the absorption spectrum, between 230 and 500 nm, as CuCl is is added to apo-TTP-2D. The apo-TTP-2D spectrum was subtracted, and the titration was performed in 200 mM HEPES, 100 mM NaCl, at pH 7.5.