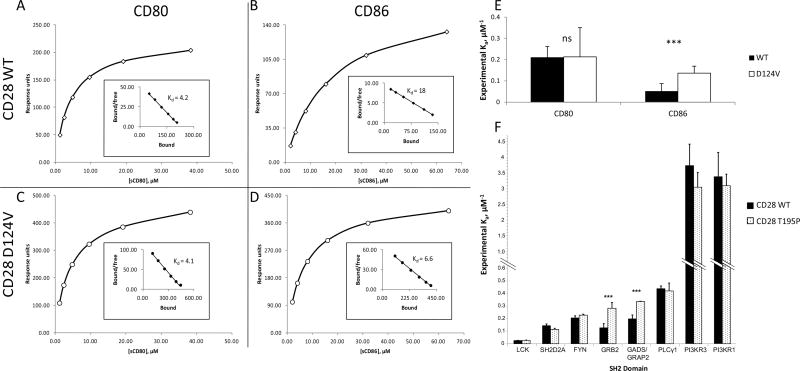
Figure 2. Differential binding affinities in CD28 WT and mutants.
A–D: Binding affinities to B7 family ligands CD80 and CD86 were compared between CD28 WT and the D124V mutant. Representative curves of CD28 WT (A, B) and D124V (C, D) binding soluble CD80 (A, C) or CD86 (B, D). The inset Scatchard plot shows the regression for the dissociation constant Kd calculation. E: The values for the association constant Ka were experimentally determined six different times; the average and standard deviation are shown. ***: p < 1×10⁻⁵ for 6 replicates; ns, not significant. F: CD28 tail motif phosphopeptides were indirectly immobilized in a flow cell and introduced to the SH2 domains of the indicated proteins. Relative affinities (mean ± standard deviation) for CD28 species experimentally determined for the SH2 domains from the indicated proteins. ***: p < 1×10⁻⁵ for 8 replicates.

