
Figure 2. Detection of radiopaque DCT hydrogel in the degenerate disc.
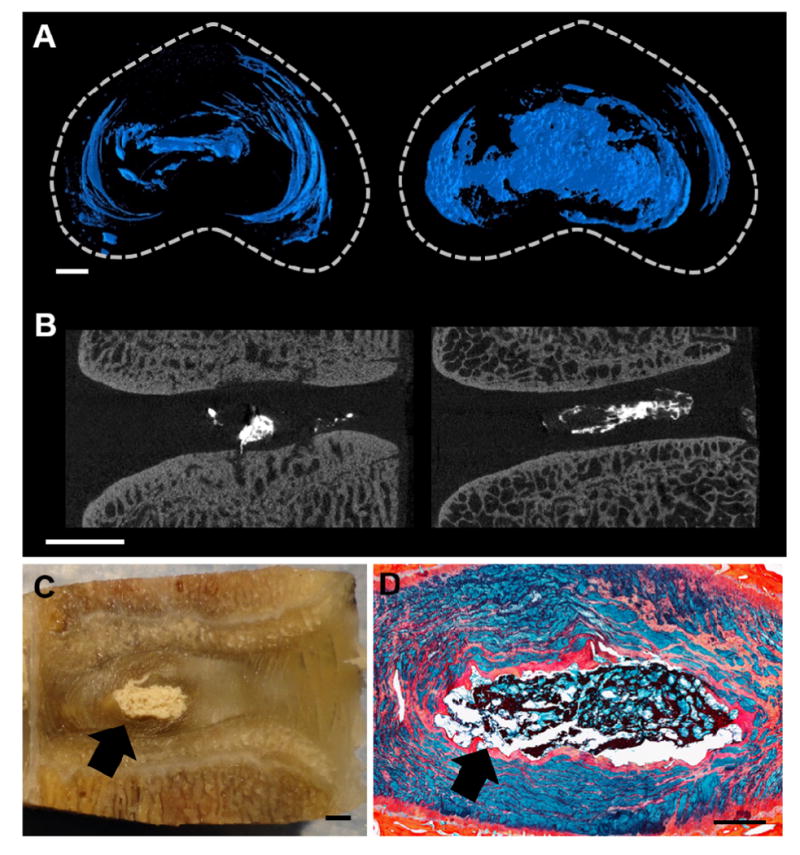
Representative (A) axial views of 3D μCT reconstructions, and (B) 2D sagittal μCT slices showing the radiopaque hydrogel within the disc (scale = 2mm). (C) Photograph of a DCT hydrogel injected motion segment following mechanical testing (scale = 2mm). The arrow indicates gel location. (D) Alcian blue and picrosirius red stained histology section illustrating the DCT hydrogel within the NP region (scale = 1 mm). The arrow indicates gel location.