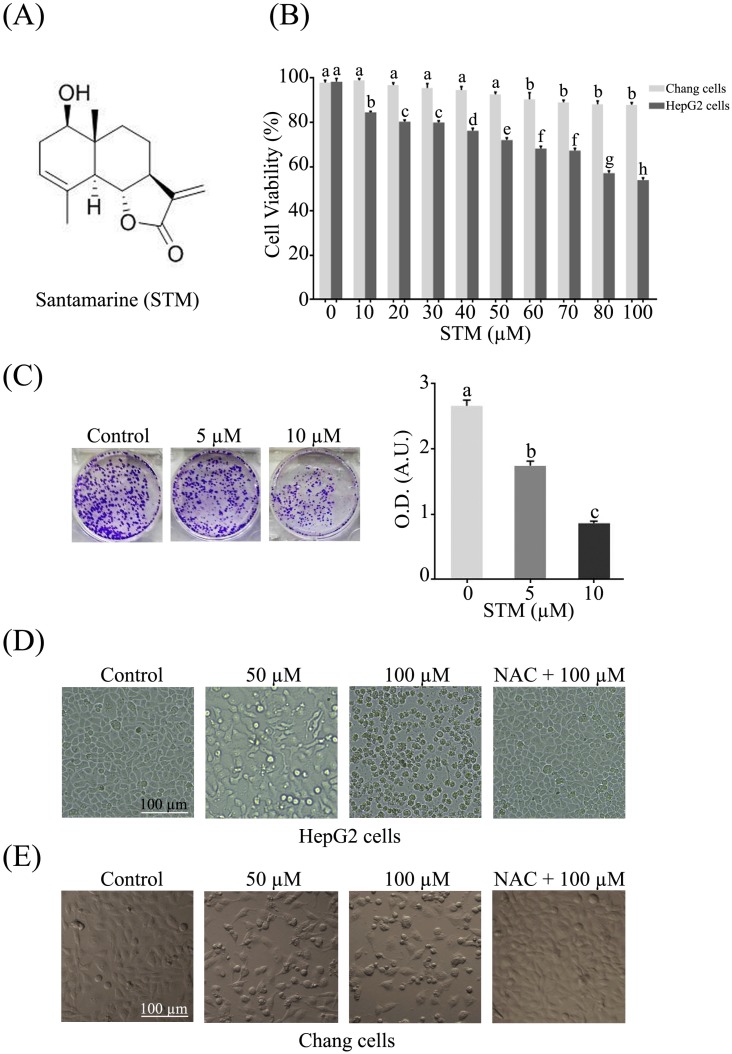
Figure 1.
Structure of STM and its effect on growth and morphology of HepG2 and Chang normal liver cells. (A) Chemical structure of STM. (B) Effect of STM on growth inhibition of HepG2 and Chang cells. HepG2 and Chang cells were treated with indicated concentration of STM for 24 h and cell viability was measured by MTT assay. Data are expressed as mean ± SD of three independent experiments. Columns not sharing the same superscript letters differ significantly (p<0.05). (C) HepG2 cells exposed to different concentrations of STM were seeded in 6-well culture plate and cultured in DMEM with 1% FBS for fourteen days. Colonies were rinsed with methanol and optical density (O.D.) in arbitrary units (A.U.) was determined at 595 nm by fluorescent spectrophotometer. (D) HepG2 cells were treated with indicated concentrations of STM in the presence or absence of 3 mM NAC for 24 h to study morphological changes by phase contrast microscopy. Scale bar = 100 µM. (E) Chang cells were treated with indicated concentrations of STM in the presence or absence of 3 mM NAC for 24 h to study morphological changes by phase contrast microscopy. Scale bar = 100 µM.

