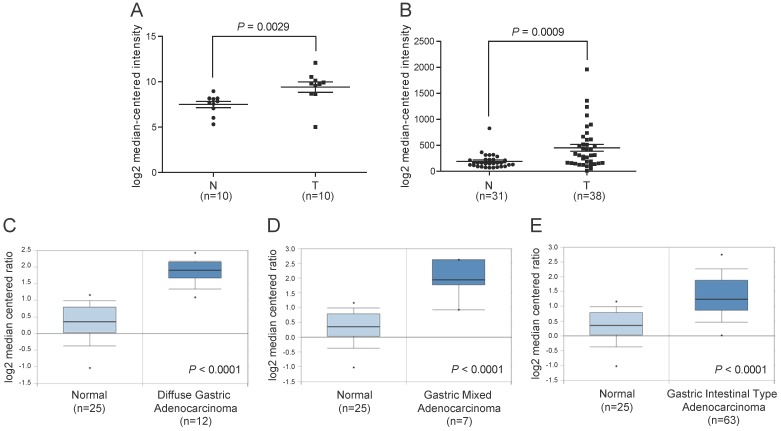
Figure 1.
Increased ITGBL1 expression at mRNA level in gastric cancer tissues. A. The mRNA expression of ITGBL1 was up-regulated in GC tissues (T) compared with the normal non-tumor tissues (N) revealed using the GSE79973 dataset. B. ITGBL1 expression in the normal gastric and GC tissues revealed by the GSE13911 dataset. C-E. Box and whiskers plots of Oncomine data on ITGBL1 mRNA levels in the normal gastric and GC tissues.

