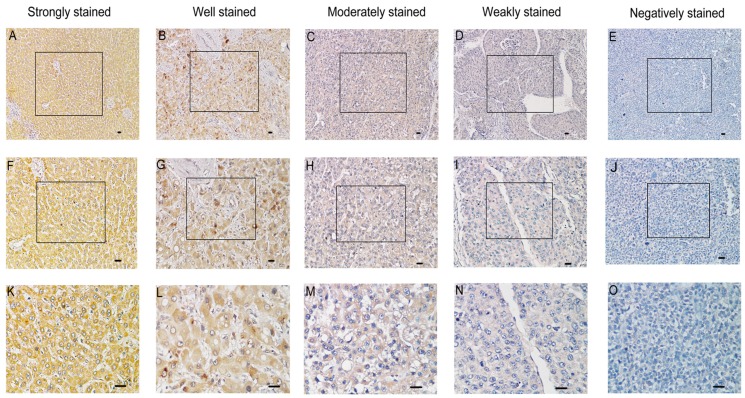
Figure 2.
Immunohistochemical analysis of SMOC2 protein expression in primary human HCC surgical specimens. A, F and K. Strongly stained normal liver tissue distant from the tumor. B, G and L. Well-stained tumor tissues (SMOC2+++). C, H and M. Moderately-stained tumor tissues (SMOC2++). D, I and N. Weakly-stained tumor tissues (SMOC2+). E, J and O. Negatively-stained tumor tissues (SMOC2-). Scale bars: 100 μm. (A-E, ×100 magnification; F-J, ×200 magnification; K-O, ×400 magnification).

