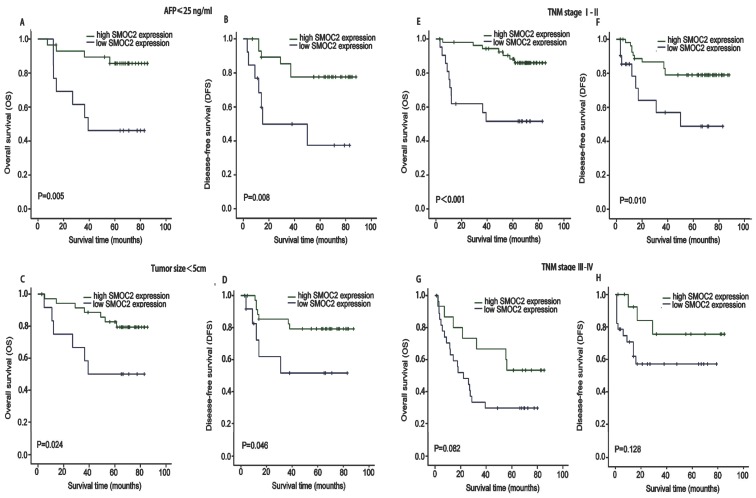
Figure 4.
Kaplan-Meier analysis of OS and DFS in subgroups of patients with HCC stratified by SMOC2 expression. A, B. OS and DFS for the subgroup with serum AFP ≤ 25 ng/mL (n = 42). C, D. OS and DFS for the subgroup with a tumor < 5 cm (n = 49). E, F. OS and DFS for the subgroup with TNM stage I-II HCC (n = 77). G, H. OS and DFS for the subgroup with TNM stage III-IV HCC (n = 43). P-values were calculated using the log-rank test.

