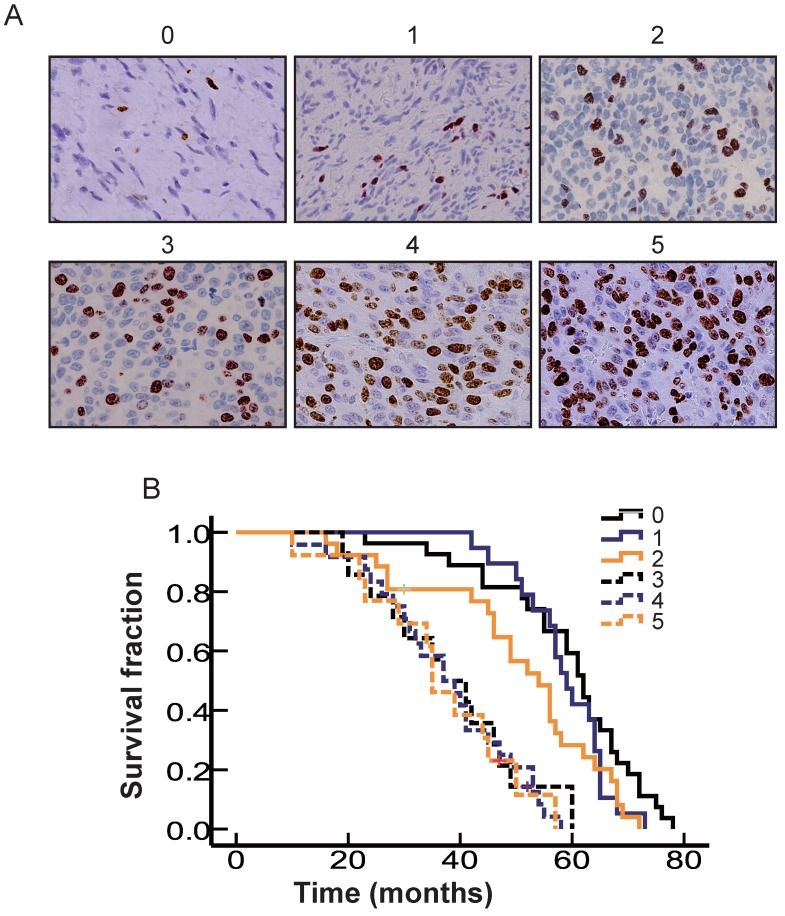
Figure 3.
The correlation of OS with differences in the cell proliferation rate in OMM. A. Representative standard of Ki67 score. B. Kaplan-Meier curves of different levels of Ki67 expression. Cases with a Ki67 score of 0-2 are indicated by a solid blue line (n = 27), a solid black line (n = 19) and a solid yellow line (n = 26). Cases with a Ki67 score of 3-5 are indicated by a dotted blue line (n = 14), dotted black line (n = 24) and dotted yellow line (n = 13).

