
Figure 1.
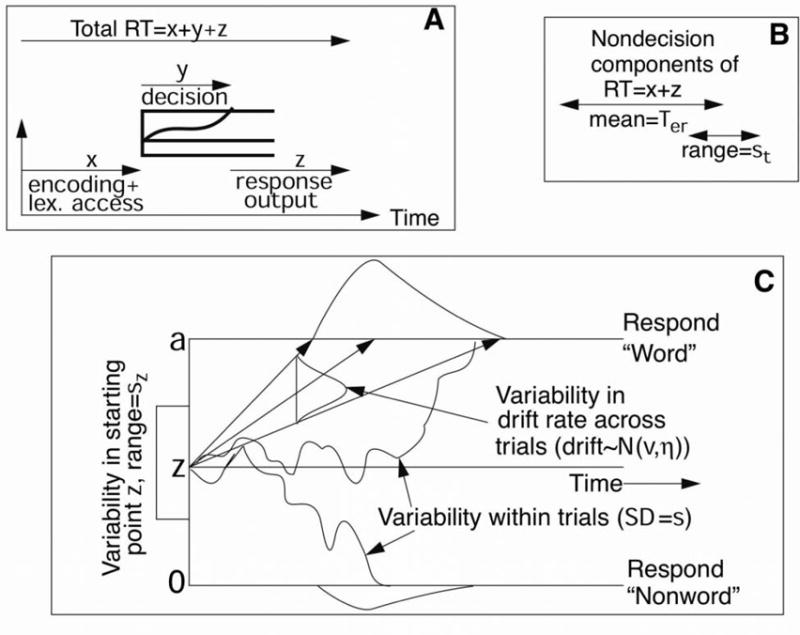
Representation of the diffusion model. Panel A shows a representation of the sequence of events in a trial of a lexical decision task. Panel B represents the nondecisional components of the response time (RT), which have a mean expressed by the Ter parameter and a range expressed by the st parameter. Panel C illustrates the diffusion model. The parameters represented in Panel C are a: boundary separation; z: starting point; sz: variability in starting point across trials; v: drift rate; η: variability in the drift rate across trials; and s: variability in drift rate within a trial.