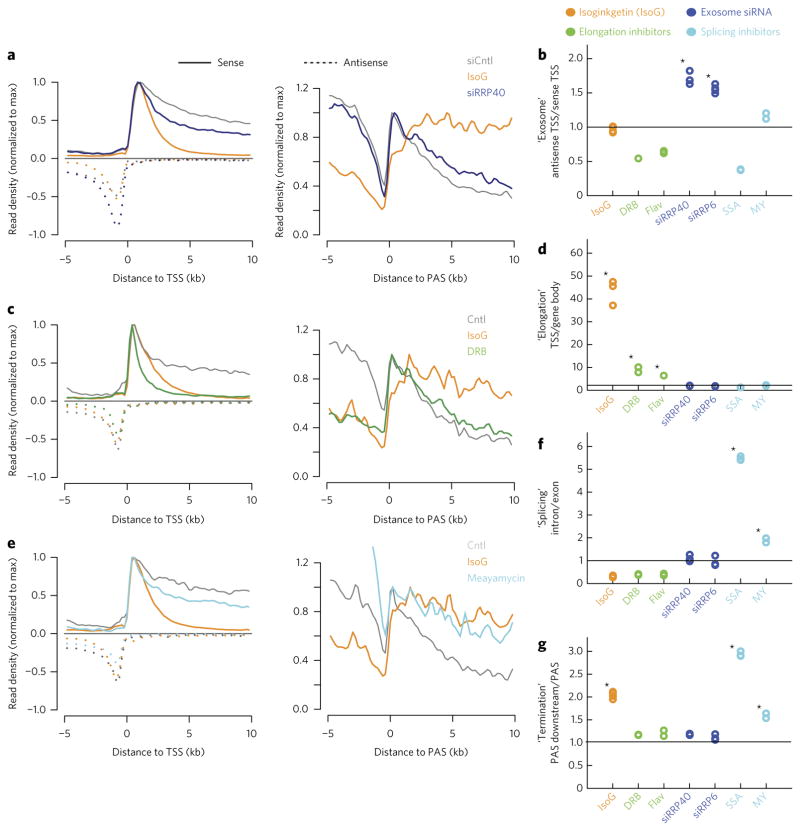
Figure 2. RNA-seq metagene-based metrics classify IsoG as a transcription elongation inhibitor.
(a,c,e) TSS-centered or cleavage and polyadenylation site (PAS)-centered metaplots showing average nonexonic RNA expression, normalized to the maximum density of sense reads downstream of the TSS or PAS, respectively. (b,d,f,g) Metagene-based metrics for each treatment, normalized to the corresponding ratios from the appropriate control samples. Quoted names (y-axis) indicate the process that metrics are designed to query and are followed by metric descriptions. (a) Comparison of IsoG with knockdown of the exosomal subunit RRP40 from analysis of previously collected data21. (c) Comparison of IsoG with the transcriptional elongation inhibitor 5,6-dichloro-1-β-D-ribofuranosylbenzimidazole (DRB). (e) Comparison of IsoG with the splicing inhibitor meayamycin (MY). In a–g, conditions are treatment with: IsoG, elongation inhibitors (DRB and flavopiridol (FP)), siRNAs targeting exosomal subunits (siRRP40 and siRRP6, published data21), or splicing inhibitors (SSA, published data21; MY). Controls (Cntl) are side-by-side vehicle- or control-siRNA-treated (siCntl) conditions. In all experiments except MY treatment, IsoG treatment was also performed side-by-side. See Supplementary Figure 2a–e and Online Methods for a full description of how each metric is computed. Traces in a,e are means from n = 2 replicates. Traces in c are means from n = 3 replicates. Stars in b,d,f,g indicate significant increases (P < 0.05) based on a one-tailed t-test with Bonferroni correction.

